Latest Post | Last 10 Posts | Archives
Previous Post: Release some hostages, please
Next Post: Point taken x2
Posted in:
* The Illinois Policy Institute via the Belleville News-Democrat…
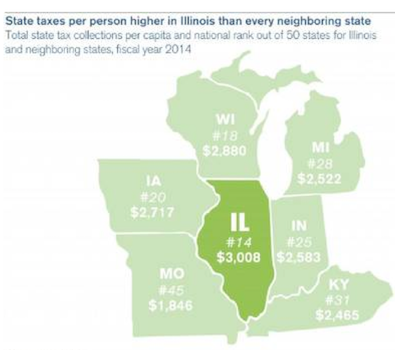
Illinois collects more in taxes per person than every neighboring state, according to new research from the nonpartisan Tax Foundation.
But Illinois Senate President John Cullerton, D-Chicago, thinks otherwise. “Our taxes are dramatically lower than all the states around us,” Cullerton said on WTTW’s Chicago Tonight on Sept. 28.
Cullerton couldn’t be more wrong. Illinois collects $3,008 in state-tax revenue per Illinoisan, nearly $200 more per person than the highest-taxing neighboring state, Wisconsin. Only 13 other states in the country take in more tax revenue per person than Illinois.
Notice the tense of the words “collects” and “take in” within that report, which was published yesterday.
* OK, now look at the accompanying chart…
* Notice the year studied? Fiscal Year 2014.
Do you know what Illinois’ personal income tax rate was in FY 14? 5 percent. What is it now? 3.75 percent.
I don’t know how Illinois ranks now with its lower rate, but “collected” and “took in” would’ve been a far more accurate way to describe the comparison from two fiscal years ago. New study, yes. New numbers, no. But, hey, that’s just me.
Cullerton is wrong about where we currently stand on taxes, however. Indiana’s personal income tax rate is 3.4 percent.
* Look, I happen to agree strongly with the Illinois Policy Institute that we have some huge problems here and we most certainly need some economic reforms. I wouldn’t go as far as them, but I concede the overall point.
And mistakes do happen. I make them a lot myself and I try to correct them when I do. But, dishonesty is just not acceptable.
posted by Rich Miller
Friday, Oct 16, 15 @ 11:28 am
Sorry, comments are closed at this time.
Previous Post: Release some hostages, please
Next Post: Point taken x2
WordPress Mobile Edition available at alexking.org.
powered by WordPress.
https://en.wikipedia.org/wiki/List_of_U.S._states_by_income
Let’s not forget that Illinoisans earn more than every state mentioned as well. Maybe they should have taken a look at percentage of income instead of actual dollars. But it is widely known that incorporating truth into research is not IPI’s bag.
Comment by Ducky LaMoore Friday, Oct 16, 15 @ 11:31 am
Where are the numbers showing that our current tax rate is creating jobs? We lowered the tax at Rauner’s request.
Doesn’t this mean things should be looking up? People should be moving here from all over. Where are these numbers? Where’s the proof that our current low tax rate spurred growth?
Or will Rauner now request — after all this — that the tax rate simply go back up — to where it was? And then we play this same game in a year?
Comment by Frenchie Mendoza Friday, Oct 16, 15 @ 11:33 am
Perhaps IPI could do a survey on FY16 budget deficits. I’m guessing Illinois is far ahead on that score.
Comment by Wordslinger Friday, Oct 16, 15 @ 11:33 am
“Figures don’t lie, but liars do figure.”
Mark Twain
Comment by 47th Ward Friday, Oct 16, 15 @ 11:34 am
IPI doesn’t deserve space in your blog, in my opinion. But I suppose it offsets the mountains of posts covering the other side of the coin.
Comment by Politix Friday, Oct 16, 15 @ 11:35 am
Dishonesty has always been acceptable to the IPI.
Comment by aunt_petunia Friday, Oct 16, 15 @ 11:35 am
And they wonder why they aren’t considered “the press.”
Comment by Demoralized Friday, Oct 16, 15 @ 11:36 am
More evidence for why no one should take the Illinois policy institute seriously.
Comment by #freedumb Friday, Oct 16, 15 @ 11:42 am
If the income tax rate is lower, and “more” revenue is there, wouldn’t the IPI call that a success story and it shows growth?
Oh, they’re misleading, my bad.
Comment by Oswego Willy Friday, Oct 16, 15 @ 11:47 am
Rich, you’re correct that Indiana’s state income tax is 3.4%. But it should be noted that every county has an additional income tax. In Marion, it’s an additional 1.77%. Also, never really mentioned is the impact of Mediciad federal reimbursement rates on how much Illinois is then required to tax. In Illinois our current rate is 50.89%. In neighboring the states IPI is focused on. Indiana-66.6%. Wisconsin- 58.23%. Iowa- 54.91%. Missouri- 63.28%. Michigan- 65.60%. Kentucky- 70.32%. If the federal formula gave us any one of those rates, the State would not have to tax it’s residents by the amount that we did.
Comment by Juice Friday, Oct 16, 15 @ 11:48 am
This following program has been paid for by the Illinois Policy Institute.
Comment by not so fast Friday, Oct 16, 15 @ 11:52 am
IPI also failed to point out the regressive nature of the Illinois tax system. Then again, they probably like that element of the Illinois tax system.
Comment by Southern Illinois Hoopdee Friday, Oct 16, 15 @ 11:57 am
Anyone want to guess which state is number one in the underlying study? Anyone guess North Dakota? If so, you are correct. They collect $7,438 per capita. Number two is Alaska… I don’t really think this study by itself means much as it excludes local governments.
http://taxfoundation.org/blog/how-much-does-your-state-collect-taxes-capita?mc_cid=718d47885c&mc_eid=228b472967
Comment by My button is broke... Friday, Oct 16, 15 @ 11:57 am
When the 5% rate was in effect, the overall tax burden per person was well above the median nationally. However, the cost of repaying the pension debt adds a substantial amount to the tax burden–perhaps a few hundred dollars according to some quick calculations. Can someone with better access to current data confirm this?
If this is true, then Illinois at a 5% rate is near the median in overall tax burden for basic government operations when the pension debt repayment is factored out.
To be down near the median in taxes supporting government expenditures (excluding its unique pension debt cost) suggests Illinois has a somewhat low tax burden given its relatively high wages, its support of a major urban center, its very extensive transportation infrastructure which is expensive to maintain in a northern climate, etc.
Comment by east central Friday, Oct 16, 15 @ 11:57 am
Here’s the best illustration of the regressive nature of our state’s taxes, with some of the important nuance you’ll not see from the IPI:
http://www.itep.org/whopays/states/illinois.php
Comment by Linus Friday, Oct 16, 15 @ 12:01 pm
One way to make a current year comparison is to adjust for the change in the personal and corporate income tax rates. In FY 14 Illinois took in $22,028 million in those combined taxes. For FY 16 last spring’s CoGFA estimate was $17,466 million, which is a decrease of $4,582 million. The Census estimates the 2014 population of Illinois at 12.8 million so the decrease equates to $358 per person. If that is subtracted from the $3008 per person on the map, the equivalent rate with the lowered taxes would be $2,650 per person. That is very close to the average for the five other states in the map excluding Missouri ($2,633).
Comment by muon Friday, Oct 16, 15 @ 12:09 pm
FYI…Indiana allows municipalities to levy lical income taxes. Illinois does not allow such taxes. Therefore, the compsrison is flawed - as usual.
Comment by Anonymous Friday, Oct 16, 15 @ 12:12 pm
and Ducky’s point is central to this issue. A far better measure than per capita is tax burden
Comment by steve schnorf Friday, Oct 16, 15 @ 12:18 pm
And IPI chart shows S. Dakota over $7K so IL must be twice as good right. This was another attempted by the Rauner rentals to make their guy look good — failed.
Comment by Anonin' Friday, Oct 16, 15 @ 12:21 pm
I wonder how much is collected in taxes (per person) if we looked at Illinois counties excluding Cook and the collar counties.
When comparing Illinois to Indiana or Iowa we should exclude Chicagoland.
With Chicagoland, we should compare IL to NY, NJ, MA and CA rather than Iowa or Indiana.
IL is a unique mix of urban and rural which makes direct comparisons with Indiana, Iowa and Wisconsin suspect. And the implosion of Detroit makes comparisons with Michigan suspect.
Comment by Bill White Friday, Oct 16, 15 @ 12:21 pm
The Gov. is laughing all the way to the bank! While he tells the taxpayers that lowering the tax rate to 3.75 will bring in more jobs to Illinois is a joke. Don’t you think the companies all know that eventually the rate will go back up to 5.0 or even higher because of their money problems so they aren’t coming in to this state. While all along the rich has gone a year with a lower tax rate here. Congrats Gov.
Comment by Coach Friday, Oct 16, 15 @ 12:22 pm
Schnorf is right.
Juice is right.
Yet another epic failure to be truthful by Ms. Rickert.
Perhaps she can say some Hail Mary’s and move on?
Comment by Juvenal Friday, Oct 16, 15 @ 12:38 pm
Ducky LaMoore’s point cannot be ignored. Illinois’ per capita income is higher than our poorer neighboring states so naturally the taxes collected per capita would generally be higher assuming comparable costs and tax rates.
Comment by Retired lawyer Friday, Oct 16, 15 @ 12:43 pm
Linus,
To be fair, the property tax part of that burden being shifted the way it is falls on Madigan and Cullerton. The Democrats have a big role in the regressive nature of the Illinois tax system.
Comment by Southern Illinois Hoopdee Friday, Oct 16, 15 @ 12:43 pm
The ITEP chart that Linus inked also shows that the greatest disparity comes not from the income tax, but from the sales taxes. The drop in sales taxes as a fraction of family income decreases by income quintile. Consider the drop from the lowest to the next to highest quintile taken from ITEP for the states in the the IPI chart.
Michigan 6.3% to 3.1%, a drop of 3.2% or 51%
Illinois 7.1% to 3.6%, a drop of 3.5% or 49%
Wisconsin 6.0% to 3.3% a drop of 2.7% or 45%
Iowa 6.3% to 3.6%, a drop of 2.7% or 43%
Indiana 7.3% to 4.2%, a drop of 3.1% or 42%
Missouri 5.8% to 3.6%, a drop of 2.2% or 38%
Illinois has the highest absolute and second highest relative inequality in sales tax burden.
Comment by muon Friday, Oct 16, 15 @ 12:49 pm
Everyone is correct, depending upon their choice of facts.
Comment by Keyser Soze Friday, Oct 16, 15 @ 1:03 pm
Illinois has lower revenue per capita according to the same tax foundation report. Why not ask why some people pay more in taxes while so many other are not paying their fair share. I don’t think IPI wants to go into that…
Comment by Liberty Friday, Oct 16, 15 @ 1:09 pm
IPI is being blatantly dishonest - our incredibly incompetent.
Either way, no one should read their crap.
Comment by VanillaMan Friday, Oct 16, 15 @ 1:28 pm
“IL is a unique mix of urban and rural which makes direct comparisons with Indiana, Iowa and Wisconsin suspect.”
Depends on what kind of comparisons are being made. If you are comparing the overall or per capita costs of state government (e.g., average/median employee salaries), then I would agree that IL should be compared to states of similar population and demographics and not just to its immediate neighbors (all of whom have less than half the population of IL last I checked).
However, when we are talking about costs placed upon RESIDENTS of these states (e.g., tax burdens), comparisons to neighboring states are still relevant for the simple reason that these costs could have a direct impact on decisions being made by current or potential IL residents (both individuals and businesses). A move from IL to IN or WI is a lot easier to make than a move from IL to NY.
Comment by Secret Square Friday, Oct 16, 15 @ 2:11 pm
“Collects” vs. “takes in”? Illinois turns over to municipal governments portions of the state sales tax and corporate income tax. So you can say the state collects those dollars, but the locals spend it. Not sure how our neighbors work things or if the IPI took this in to consideration. The way each state taxes can vary widely. You can mix apples and oranges and come up with a “study” to prove any argument.
Comment by Ricardo Friday, Oct 16, 15 @ 3:02 pm
the problem with that per person number is that our neighbor states have graduated taxes. so they are taking the higher tax rates paid by the wealthy and averaging them down to the middle class to make it look like the middle class and down pay higher taxes.
cullerton is looking at the top tax rates on graduated systems. all of our neighbors have higher taxes because they tax those with more income at higher rates…. in essence we are comparing apples and oranges. take wisconsin. the income tax rate is 7.65 at the top! that is way over illinois 3.5 and ocer its prior 5. and for illinois policy institute to bury that in an average is just misreporting and manipulating the truth.
Il per person tax rate at the top is half of that of wisconsin. period. so we either need to raise everyone (doable now) or go to a graduated system (long way away).
fyi the reaso. wisconsin takes in a lot less income tax is because their median household income is crashing. they pay less because they make less and year over year wisconsin households are falling. so wisconsin has higher taxes, but its middle class is dosappearing and median household income is dropping.
not a good model for il. an economy needs households with the ability to spend.
Comment by Ghost Friday, Oct 16, 15 @ 3:12 pm
Illinois, as a % of Gross State Product, spends 5% above national average and taxes 10% below. The 2014 collections reflect the tax hike which was an attempt to make up for the low tax rate of 3.75. In 2011 Illinois per capita income was 22% above the surrounding 6 states cited, but taxes were only 5% above the average of those 6 states. Yeah, repaying pension shortages does cost money.
Comment by Ottawa Otter Friday, Oct 16, 15 @ 3:20 pm
Why did my comments get deleted? Too many bothersome facts?
Nice one way conversation
Comment by What? Friday, Oct 16, 15 @ 4:04 pm
My mistake. I apologize. Something went wrong with my computer.
Comment by What? Friday, Oct 16, 15 @ 4:05 pm
Put another way, in 2012, the average of the 6 states for after tax income, that is disposable income was $35,628.00. Illinois was $40,346.00. There was and is plenty of room for a tax hike of 1.75% to balance the budget.
Comment by ottawa otter Friday, Oct 16, 15 @ 4:15 pm
I’ve got to agree with others. For 2015, state and local individual income tax for residents is lower in Illinois (3.75%) than all Indiana counties except Sullivan (3.7%) and Vermillion (3.5%) and goes as high as 6.53% in Pulaski county. In addition, some IN counties tax income of people who work in those counties but don’t reside there. So no contest, IL wins for lowest income taxes in the region.
These IPI stats are meant to misdirect public opinion. Don’t be fooled.
Comment by X-prof Friday, Oct 16, 15 @ 4:28 pm
… and Cullerton is right.
Comment by X-prof Friday, Oct 16, 15 @ 4:31 pm