Latest Post | Last 10 Posts | Archives
Previous Post: Question of the day
Next Post: *** UPDATED x9 *** So far today…
Posted in:
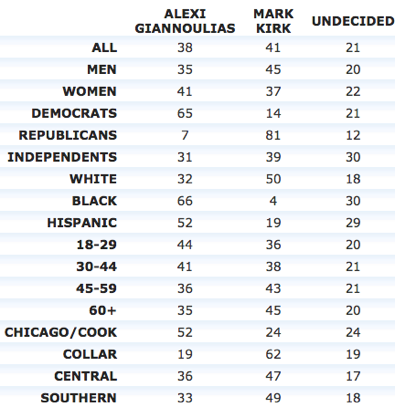
* The last Research 2000 poll conducted in February for Daily Kos didn’t even come close to matching up with anybody else. R2K had Mark Kirk and Bill Brady both trailing. They’re somewhat more in line now.
One reason may be that their sample of senior citizens is larger than before, which they’ve taken heat for in the recent past. They had their 60+ at 16 percent before, when the 2006 gubernatorial exit polling had that number at 29 percent. This time, their sample size is up to 20. That’s still not good enough, so adjust for the Republicans accordingly.
The number in parentheses is R2K’s February result. The numbers in brackets are other recent polls, which can be found here…
Alexi Giannoulias (D) 38 (43) [38, 33, 37, 44]
Mark Kirk (R) 41 (36) [46, 37, 41, 41]
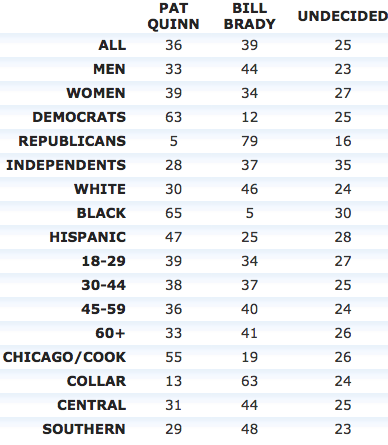
* And why they would put Scott Lee Cohen into a question and not Rich Whitney, who, unlike Cohen, is actually on the ballot, is totally beyond me. Anyway, they now have Quinn trailing Brady by a few points rather than leading Brady by eleven, which was completely blown away by other polling. Same thing goes for the parentheses and brackets. Results from those other polls are here…
Pat Quinn (D) 36 (46) [38, 33, 38, 37]
Bill Brady (R) 39 (35) [45, 43, 45, 47]Pat Quinn (D) 35
Bill Brady (R) 39
Scott Lee Cohen (I) 3


* Trendlines…
* Methodology…
The Research 2000 Illinois Poll was conducted from May 3 through May 5, 2010. A total of 600 likely voters who vote regularly in state elections were interviewed statewide by telephone. Those interviewed were selected by the random variation of the last four digits of telephone numbers. A cross-section of exchanges was utilized in order to ensure an accurate reflection of the state. Quotas were assigned to reflect the voter registration of distribution by county.
The margin for error, according to standards customarily used by statisticians, is no more than plus or minus 4% percentage points. This means that there is a 95 percent probability that the “true” figure would fall within that range if the entire population were sampled. The margin for error is higher for any subgroup, such as for gender or party affiliation.
posted by Rich Miller
Friday, May 7, 10 @ 12:42 pm
Sorry, comments are closed at this time.
Previous Post: Question of the day
Next Post: *** UPDATED x9 *** So far today…
WordPress Mobile Edition available at alexking.org.
powered by WordPress.
Since Markos is an NIU grad and a Cubs fan I would have expected him to do better with the poll. Whitney should have been included along with “other” since various other candidates are attempting to qualify for the ballot, but haven’t yet.
Comment by Carl Nyberg Friday, May 7, 10 @ 12:45 pm
That collar number for Alexi is interesting…
Comment by OneMan Friday, May 7, 10 @ 1:00 pm
The collar numbers are interesting for both Alexi and Quinn. Shocking, even.
Comment by Sewanee Friday, May 7, 10 @ 1:01 pm
This looks right.
Perfect, actually.
As to the results, well…
Comment by VanillaMan Friday, May 7, 10 @ 1:04 pm
Looks like Kirk is now leading but Alexi is still in the game.
Comment by Harry Friday, May 7, 10 @ 1:06 pm
I am not sure I buy the margin of error is +/- 4% …
Comment by Ghost Friday, May 7, 10 @ 1:08 pm
Kirk with better numbers than Brady in the South?
Comment by I-N-I Friday, May 7, 10 @ 1:41 pm
Wow, I actually would have expected the central and southern numbers to be stronger for Kirk and Brady. Especially with Central being Brady’s base and Kirk has higher numbers in the region… definitely leaves you with a lot of questions.
Comment by A.B. Friday, May 7, 10 @ 1:43 pm
these numbers six months out tell me a pollster made some money…
Comment by Loop Lady Friday, May 7, 10 @ 1:50 pm
How do those collar numbers look interesting or “shocking”? The collars are predominantly white and conservative, right?
I’m gusesing those Brady numbers will continue to trend the other way as people get to know him. And before anyone attackd me, I said “I’m GUESSING”.
The interesting thing to me is how many undecideds there are. THOSE will be the numbers to watch.
Comment by ShadyBillBrady Friday, May 7, 10 @ 2:00 pm
===I’m gusesing those Brady numbers will continue to trend the other way as people get to know him.===
What’s not to like? Gassing puppies? Social stances that would be extreme in Utah in 1950? The average voter loves that type of thing.
Comment by Obamarama Friday, May 7, 10 @ 2:05 pm
===The collars are predominantly white and conservative, right?===
Obama won 51% to 55% in the collars, Quinn is polling at 13% in the collars. I know in ‘08 we were voting to put a fellow Illinoisan into the White House, but it does show that the collars aren’t automatically conservative.
Comment by Sewanee Friday, May 7, 10 @ 2:16 pm
- ShadyBillBrady -
The Collar Counties are usually the bed rock of your independent or swings votes. In most years this is the area that consistently decides the statewide winners.
Comment by A.B. Friday, May 7, 10 @ 2:19 pm
In both of those polls, the only choices were a Republican, a Democrat, and undecided. Each race will have at least five candidates, so the pollsters should have given at least five candidate choices.
Comment by Conservative Veteran Friday, May 7, 10 @ 3:19 pm
===Each race will have at least five candidates==
Poppycock.
Comment by Rich Miller Friday, May 7, 10 @ 3:20 pm
Sewanee, I believe I said “predominantly”, not “automatically”. Obama won in a lot of places that usually went Red, by the way.
I still believe the most important numbers there, as I said before, are the undecideds. And a lot of them may well be in the collars.
Comment by ShadyBillBrady Friday, May 7, 10 @ 3:39 pm
The collars have become much more Dem over the years. To be zonked like that in the collars is very bad news, indeed. Move along.
Comment by Rich Miller Friday, May 7, 10 @ 3:41 pm
I agree, getting zonked like that is bad news indeed.
But I guess it’s less surprising to me than to some others. What I see is that Alexi and Quinn had similar numbers in the collars - few more for Alexi, but also a few less undecideds. Could be that’s a factor of Alexi and Kirk both being better known up there and Brady not being as well known north of 80. In fact, the numbers up and down, collars and not, seem to be pretty similar in both races for the D and the R.
Collar numbers could be party affiliation, could be demographics, could be something totally different I guess. Likely a combination … On the surface though? Bad news for Alexi and Quinn, but not terribly surprising. At least to me.
Comment by ShadyBillBrady Friday, May 7, 10 @ 3:58 pm
The results in the collar counties are following the same trends that occurred in the suburbs in Virginia, Jersey & Massachusetts…all of which overwhelmingly voted for Democrats in ‘06 & ‘08, but swung back to Republicans in ‘09 & ‘10.
I think once Kirk has more presence in Southern Illinois, his numbers will improve there.
Comment by Steve-O Friday, May 7, 10 @ 4:25 pm
My gut feeling on the polls to now is that Kirk’s support seems too low and Brady’s seems too high.
The collar numbers have to make Brady feel real good. Still, if you go back to the primary, Quinn got more votes the collars than Brady did. There’s your base.
Comment by wordslinger Friday, May 7, 10 @ 5:11 pm
=Still, if you go back to the primary, Quinn got more votes the collars than Brady did. =
Was it really and apples-to-apples comparison? 2 man race vs. a 6 man race?
Comment by Steve-O Friday, May 7, 10 @ 5:44 pm
Looks like Brady is starting to slip. More people finding out he’s a lightweight. Quinn is too but it’s a Democratic state.
Comment by just sayin' Saturday, May 8, 10 @ 12:01 am