Latest Post | Last 10 Posts | Archives
Previous Post: Morning shorts
Next Post: Odelson swears Stroger is a reformer *** Updated x1 ***
Posted in:
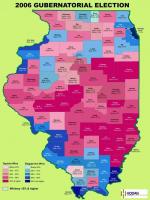
Glenn Hodas, a political consultant and numbers cruncher, has provided us with some nifty maps and graphs to help us understand this year’s election a little bit better. Click all the images for larger versions.
I’ve had to reduce the file sizes to make the images load better on the Internet, but if you want to see the maps, etc. in all their high-rez glory, just head over to Glenn’s website and find his contact information. I’m sure he’ll do whatever he can to help
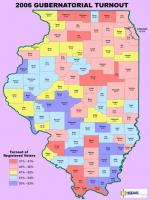
First, a color-coded statewide map gives us the intensity of the vote for governor…

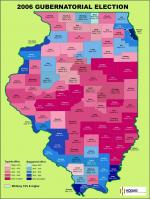
If you want to see a much bigger statewide map, click on this image…
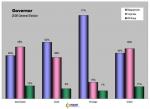
Next up, a bar graph that gives us the governor’s race head-to-head percentages by region…
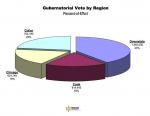
This pie chart will give you a very clear picture of how each region turned out on Tuesday…
And here’s a county map that shows the same thing…
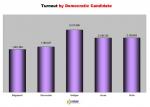
This bar graph shows how each of the statewide Democratic candidates did against each other…
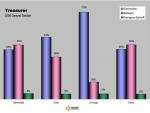
The chart below shows how the treasurer candidates did by region…
OK, back to the governor’s race. The following charts show how the suburban vote changed from 2002 (Rod Blagojevich vs. Jim Ryan) to 2006. Notice that the Republican numbers dropped in every case.

posted by Rich Miller
Friday, Nov 10, 06 @ 3:00 am
Sorry, comments are closed at this time.
Previous Post: Morning shorts
Next Post: Odelson swears Stroger is a reformer *** Updated x1 ***
WordPress Mobile Edition available at alexking.org.
powered by WordPress.
Where’s the Aurora Election Commission’s totals?
Comment by anon Friday, Nov 10, 06 @ 4:30 am
All the results are included in the Kane County graph. Please, always try to look before you jump. Thanks.
Comment by Rich Miller Friday, Nov 10, 06 @ 4:35 am
Great charts Rich. Very informative.
Comment by Charles Martel Friday, Nov 10, 06 @ 5:51 am
This is very useful. I’m looking for Cook County township results in the County Board President and Governor elections — anyone?
Comment by Little Egypt Native Friday, Nov 10, 06 @ 11:38 am
Wow, Blago outright won only 32 counties. His drive from Chicago to Springfield doesn’t look too friendly. I can see why he goes down so seldom.
Comment by Little Egypt Friday, Nov 10, 06 @ 11:41 am
Lisa had over 750,000 more votes than the Governor. Let the 2010 election begin!
Comment by So Blue Democrat Friday, Nov 10, 06 @ 11:58 am
Great Information. Very well presented!
Comment by Justice Friday, Nov 10, 06 @ 11:59 am
Lil E, www.Voterinfonet.com or gov.
Comment by Wumpus Friday, Nov 10, 06 @ 12:33 pm
I keep telling you guys, we immigrants and our kids are chaning the political demographics in the suburbs.
Roskam just got in, and probably foolishly made some permanent enemies in the Latino community (and “permanent enemies” is a not-too-often phenomena in the world political).
The immigrant vote was a factor in the Noland victory, the Crespo victory, the Bond victory and the Katowski victory.
The Illinois Republican Party can say as much as they want that they want to broaden and diversify… but they drank the anti-immigrant Kool Aid, and those mailers they put out have their name on them!
Stuuuuuuu-pid!
Comment by Tomorrow We Vote Friday, Nov 10, 06 @ 12:52 pm
I don’t understand the pie chart %. Does that mean only 19% came out in the City. I thought it was much higher than that? Please explain.
Comment by Garp Friday, Nov 10, 06 @ 2:45 pm
Never mind-I figured it out-just a little slow on the uptake.
Comment by Garp Friday, Nov 10, 06 @ 2:47 pm
How is it that so much of the state is red and hair do still won?
Comment by huh? Friday, Nov 10, 06 @ 3:56 pm
===How is it that so much of the state is red and hair do still won?
Because we have this weird rule called one person one vote, not one vote per acre of land.
Comment by archpundit Friday, Nov 10, 06 @ 4:17 pm
Huh…
Its simple… the rural counties are by far less populated. If you combine all the rural votes I dont think they will catch up to the chicago/cook county votes.
My sympathies to the ILGOP… NOT!! Time to get rid of the dinosaurs if the ILGOP really wants an outside chance of making a blip of noise.
Comment by Silas Friday, Nov 10, 06 @ 5:41 pm
For the same reason that almost all the state was red and Kerry won.
Comment by steve schnorf Friday, Nov 10, 06 @ 10:46 pm