
Latest Post | Last 10 Posts | Archives
Previous Post: Dealing with the expected horde
Next Post: *** UPDATED x2 *** House to take up property tax freeze, Purvis invited to testify
Posted in:
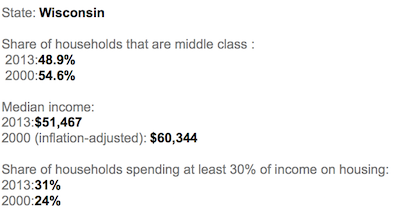
A new state-by-state analysis from the Pew Charitable Trusts shows that Wisconsin experienced the biggest decline in middle-class households in the country between the years 2000 and 2013.
The study found that the percentage of households in the middle class dropped in all 50 states, with Wisconsin’s drop from 54.6 percent to 48.9 percent being the most significant. Moreover, Wisconsin saw a 14 percent decline in median household income.
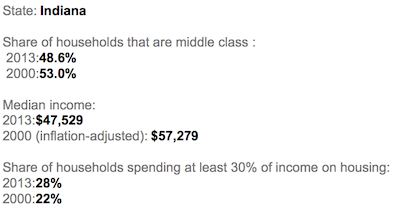
* A look at our neighborhood. The darker the color, the greater the problem…
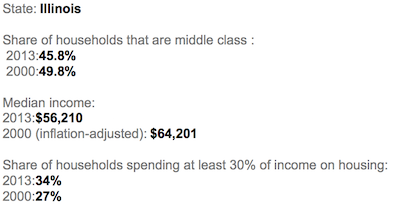
* Illinois isn’t faring much better, however…
posted by Rich Miller
Monday, Jun 8, 15 @ 2:14 pm
Sorry, comments are closed at this time.
Previous Post: Dealing with the expected horde
Next Post: *** UPDATED x2 *** House to take up property tax freeze, Purvis invited to testify
WordPress Mobile Edition available at alexking.org.
powered by WordPress.
Check back in 3.5 years. We might make up some ground on Wisconsin, yet!
Comment by 3rd Party Needed Monday, Jun 8, 15 @ 2:18 pm
Not much better ….TeamBungle wishes that was true but not IL still has highest income and smaller drop than the neighbors from Cheney-Bush Depression. That is why the race to be West Indiana (or South Wisconsin) is such a sloppy idea
Data like this really destroys the spiel from TeamBungle
Comment by Anonin' Monday, Jun 8, 15 @ 2:24 pm
New Wisconsin motto:
Shut up - you’re lucky to have a job.
Comment by Norseman Monday, Jun 8, 15 @ 2:27 pm
@Norseman,
I think the new state motto should be “Busting unions and lowering wages”
Comment by How Ironic Monday, Jun 8, 15 @ 2:31 pm
Rich, just out of interest, how did they define “middle class”?
Comment by Commonsense in Illinois Monday, Jun 8, 15 @ 2:31 pm
Was wondering what their definition of middle class was as well.
Comment by Lil Squeezy Monday, Jun 8, 15 @ 2:32 pm
CHEESEHEADS –nuff said
Comment by View from the Cheap Seats Monday, Jun 8, 15 @ 2:39 pm
I’m also curious how much of that decline has occurred since Walker busted the public employee unions.
Comment by Tournaround Agenda Monday, Jun 8, 15 @ 2:39 pm
If I judge by the graphic, it appears West Virginia is best off. Sorry, I’ll take a grain of salt with the conclusion.
Comment by Allen Skillicorn Monday, Jun 8, 15 @ 2:39 pm
The Pew description at the link in the story above provides the definition of middle class:
“..A new Stateline analysis shows that in all 50 states, the percentage of ‘middle-class’ households—those making between 67 percent and 200 percent of the state’s median income—shrunk between 2000 and 2013. The change occurred even as the median income in most states declined, when adjusted for inflation. In most states, the growing percentage of households paying 30 percent (the federal standard for housing affordability) or more of their income on housing illustrates that it is increasingly difficult for many American families to make ends meet…”
Comment by Loki Monday, Jun 8, 15 @ 2:42 pm
Per the report, they defined middle class as “those making between 67 percent and 200 percent of the state’s median income”
In Illinois, the median income for 2013 was $56,210.
Comment by Name Withheld Monday, Jun 8, 15 @ 2:44 pm
P-EW!
Comment by VanillaMan Monday, Jun 8, 15 @ 2:46 pm
GOP presidential candidate Scott Walker: will do for the country what he did for Wisconsin
Comment by Nick Name Monday, Jun 8, 15 @ 2:52 pm
That’s what happens when you start selling off the breweries.
Comment by Joe Schmoe Monday, Jun 8, 15 @ 2:54 pm
I asked last week……as middle class earners (who bear the brunt of the tax payments to support the lower classes) drift downward into the lower class, who will be paying to support the increasing lower class? Those in the upper echelon don’t seem real eager right now to pay one cent more. Who will pay?
Comment by AnonymousOne Monday, Jun 8, 15 @ 2:55 pm
I like it when people who don’t read the article have questions that can be resolved by reading the first paragraph of the article.
Comment by Anon Monday, Jun 8, 15 @ 2:57 pm
==If I judge by the graphic, it appears West Virginia is best off. Sorry, I’ll take a grain of salt with the conclusion.==
i believe this is only measuring overall change. it’s hard to have any decline when WV is the second poorest state in the nation…
Comment by Anon Monday, Jun 8, 15 @ 2:57 pm
Rauner would like to emulate his hero Walker in the race to the bottom.
Comment by Wensicia Monday, Jun 8, 15 @ 2:58 pm
“I keep cutting and cutting but this board is still too short.”
You can’t cut your way to prosperity.
Comment by 47th Ward Monday, Jun 8, 15 @ 3:06 pm
There is a relatively simple explanation for the decline of the middle class in Wisconsin, no matter how we want to define it. Gov. Scott Walker’s “budget repair bill,” also known as Act 10 which severely restricted the power of public-employee unions to bargain collectively is in large part responsible for this development.
The Wisconsin State Employees’ Union, have stated that their take-home pay has fallen more than 10 percent on average since the passage of Act 10, a sign of the union’s greatly diminished power. In Oneida County in northern Wisconsin, the county supervisors jettisoned language requiring “just cause” when firing employees. All over the state, public executives are exercising new authority. Instead of raising teachers’ salaries, the Mequon-Thiensville School District, near Milwaukee, froze them for two years, saving $560,000. It saved an additional $400,000 a year by increasing employee contributions for health care.
I could go on and on, but you get the idea, and so does Governor Rauner.
Comment by Rod Monday, Jun 8, 15 @ 3:08 pm
@Wensicia, my thoughts exactly. It is just common sense that right to work laws and eliminating prevailing wage laws is going to reduce the number of households in the middle. As some of these households drop out of the middle class they are then eligible for government assistance.
The Governor and some of his supporters call some of their reform agenda “pro business”. It would be just as accurate to call it “anti middle class” because as you see with Wisconsin, the middle class shrinks once those reforms are implemented. The more decent paying jobs a state has the better off they are. Higher paying jobs equal more tax receipts for the state, which we need.
Comment by The Dude Abides Monday, Jun 8, 15 @ 3:16 pm
Rod, your quickie analysis leaves out the years preceding Walker’s tenure and then uses union derived numbers to lead to your already drawn “simple” conclusion. Please start over.
Comment by Nick Danger Monday, Jun 8, 15 @ 3:16 pm
Agreed @Wensicia. “Rauner would like to emulate his hero Walker in the race to the bottom.” The fact that Walker is one of Rauner’s heroes should terrify people. Rauner is Walker on steroids with billions. Again. Terrifying!
Comment by Anon Monday, Jun 8, 15 @ 3:19 pm
Farm more to this than what it appears. The biggest change to what percentage the middle class makes up has to do with birth rates. Lower incomes have more kids. It isn’t about the middle class slipping, it’s about the lower incomes reproducing more and becoming a bigger part of the population.
This is from 2010, quickest I could find in a quick search.
http://www.statista.com/statistics/241530/birth-rate-by-family-income-in-the-us/
Look at the under 10k per year!
Comment by mcb Monday, Jun 8, 15 @ 3:20 pm
How depressing to see.
Comment by Very Fed Up Monday, Jun 8, 15 @ 3:20 pm
Pretty clearly caused by the off-shoring of manufacturing jobs and the de-unionization of the workforce….otherwise known as the Gospel According to Bruce.
Comment by PTR Monday, Jun 8, 15 @ 3:20 pm
Here’s another from slate, certainly not a right wing publication.
http://www.slate.com/articles/double_x/doublex/2011/09/knocked_up_and_knocked_down.html
Comment by mcb Monday, Jun 8, 15 @ 3:22 pm
Good God folks. Enough with the Walker bashing and use your noggin. This is from 2000-2013. Walker took office in 2011. Most of the period cited was when the Dems held the gov office. Any effect from Walker would have been marginal during this period. I’ve yet to see anyone blame Jim Doyle. seesh.
Comment by Stan Monday, Jun 8, 15 @ 3:22 pm
@Stan,
The decline didn’t start in 2000. That’s just one of the two years used for comparison.
Comment by Wensicia Monday, Jun 8, 15 @ 3:24 pm
@Wensicia
=The decline didn’t start in 2000. That’s just one of the two years used for comparison.=
Please share the data bc it isn’t in the article. Are you just assuming it didn’t start in 2000? When did it start 2011?
Comment by Stan Monday, Jun 8, 15 @ 3:27 pm
Actually, you need to know what “classes” to which the households migrated. For example, what if those 4% of households in Illinois that left the middle class in Illinois ascended to the “upper class”? Or did the 4% in Illinois drop to the “lower class” while the 4.4% in Indiana go to the upper class? It sure makes a difference in judging whether a shrinking middle class is a good thing.
Wait, wouldn’t it be offensive in Illinois if the middle class rose to upper class? That would actually INCREASE income inequality! The Horror! The only fair thing to do would be to tax those who moved up at confiscatory rates, or, better yet, drive them out of the state.
I think you’d have to call that policy “Illinois economics”.
Comment by Arizona Bob Monday, Jun 8, 15 @ 3:27 pm
Bob:
The median income decreased. There’s your answer.
Comment by Demoralized Monday, Jun 8, 15 @ 3:31 pm
Stan, that does not fit the narrative nor group think of this blog.
Comment by Allen Skillicorn Monday, Jun 8, 15 @ 3:37 pm
Once again, birth rates. Nobody ever seems to grasp this. It’s very simple. You’re less likely to get a degree if your parents didn’t, more likely to be on welfare and food stamps if your parents were. And more of the non-degree, entitlement families have more kids. It’s simple.
Here’s a quote from the slate link from earlier:
“the rates of unplanned pregnancies and births among poor women now dwarf the fertility rates of wealthier women”
Comment by mcb Monday, Jun 8, 15 @ 3:38 pm
Guess what? Actions of Governors have little to do with these kinds of economic trends.
So much unnecessary strife between true believers. So many Growth or Turnaround Agendas! All overblown.
Political parties, candidates and campaigns resound with economic hubris.
Comment by walker Monday, Jun 8, 15 @ 3:40 pm
@MCB
“Here’s a quote from the slate link from earlier: “the rates of unplanned pregnancies and births among poor women now dwarf the fertility rates of wealthier women””
And yet the GOP consistently fights any effort to promote a robust sex ed program in public schools, fights initiatives to provide low or no cost birth control, and then has the audacity to complain that people continue to have more children.
Comment by How Ironic Monday, Jun 8, 15 @ 3:44 pm
@Allen Skillicorn= The study does not support your narrative either, therefore you diminish it with a faulty comparison to WV in your first post.
That narrative is easy to stick to when you let it do the “thinking” for you.
Comment by JS Mill Monday, Jun 8, 15 @ 3:52 pm
===And yet the GOP consistently fights any effort to promote a robust sex ed program in public schools, fights initiatives to provide low or no cost birth control,===
Because Jesus. Or something.
Comment by 47th Ward Monday, Jun 8, 15 @ 3:54 pm
I’d love to know what happened to the middle class nationally during the Obama years!
Comment by Stan Monday, Jun 8, 15 @ 3:58 pm
@mcb
There’s some truth to what you’re saying, but birth rates among the poor have ALWAYS been higher than the birth rates of the wealthy and that fact has historically been blamed — by rich people — as one of the leading causes of poverty. (That’s why good Republican families like the Eisenhower’s, Goldwaters, and Bushes were among the early supporters of Planned Parenthood.)
Maybe the poor vs. rich fertility gulf is widening, but that Slate story you linked to talks about the gulf growing in the past 5 years, which would not register in a study of income levels between 2000 and 2013.
Something else is causing this slide by the middle class, and it’s not Scott Walker. It’s the loss of good-paying, low skilled industrial jobs to third world nations. Something from which Bruce Rauner and his investors have profited.
Comment by PTR Monday, Jun 8, 15 @ 4:11 pm
Via today’s NY Times, Gov. Walker’s tax cuts aren’t panning out so hot either.
In Wisconsin, Mr. Walker signed into law last year a $541 million tax cut that benefited both families and businesses. But expectations of a surplus dissipated amid slow job growth, and now the state faces a budget shortfall of more than $280 million.
http://mobile.nytimes.com/2015/06/08/us/states-confront-wide-budget-gaps-even-after-years-of-recovery.html?_r=0&referrer=
Comment by LakeviewJ Monday, Jun 8, 15 @ 4:15 pm
Well let’s see. We can’t let them use birth control, nor do we give them things to do other than you know what as recreation. Explain how we’re going to keep the economically disadvantaged from having so many children?
Comment by Cheryl44 Monday, Jun 8, 15 @ 4:16 pm
MCB
Per your interesting argument …
… I await your data that what you term the “lower class” outgrew the middle the fastest - in Wisconsin - , between 2000 and 2013.
If the “lower class” in fact grew faster in some other states, from 2000-2013 … I really doubt the trend here across the 50 states, matches your explanation, in terms of your X matching Pew’s Y. But, again, willing to hear the case.
Comment by ZC Monday, Jun 8, 15 @ 4:17 pm
– If I judge by the graphic, it appears that West Virginia is best off.–
Allen, that’s why learning to read is so important. You get so much more information and a better understanding of fhe issues. Check your local library or community college for adult literacy programs.
Income stagnation is a national problem, but one that would be exacerbated here by Gov. .1%’s agenda to reduce the standard of living for all residents except for himself and cronies.
Comment by Wordslinger Monday, Jun 8, 15 @ 4:22 pm
47th, that would be Jeebus.
Comment by Nick Danger Monday, Jun 8, 15 @ 4:23 pm
AZ Bob, wait for the movie, dude. The words have you confused.
Comment by Wordslinger Monday, Jun 8, 15 @ 4:30 pm
This map is a perfect example how you can manipulate ignorant people with data.
IL: Down 4-percentage points
WI: Down 5.7 percentage points
One a smaller population is easier to have a larger percent change. But the funny part is that:
IL has 45.8% in middle class while
WI has 48.9% in middle class
That means using this measure they are doing better. Duh.
But another part of this BS map is what percentage is in the upper class and what percent is in the below middle class? Did they change cut off scores to be in these classes between 2000 and 2013?
Who knows. That map isn’t enough for you to know much other than dark blue is “BAD” even if its data is only slightly different than the lighter blues.
Comment by Dudeman Monday, Jun 8, 15 @ 4:34 pm
-zc-
If anyone really wants some elaboration, I’m happy to provide it.
The whole disappearing middle class thing is a pet peeve of mine. Yes, the loss of many jobs to other countries is a serious problem, but those waves hit everyone not just one group.
But to the point, here goes, the “middle class” is a statistical creation. Generally, it can’t grow or shrink, because it is simply the people who occupy a particular chunk of the scale. Because of how averages or means work, it is always the middle __% (dependent on the analyst’s definition), so it can’t change as a percentage of the population.
So, like this study, people look to what percentage earns the mean, or over, or under. But the mean is a different construct than the “middle class”.
The highest incomes can always rise, because there is no cap. But there is a bottom, because zero is always in the same place. So as top incomes rise, regardless of how many people earn them, the mean rises. Then add to that the fact that the population of lower incomes is exploding. Those two effects pull the mean further from the bottom, causing it to move higher, above more and more people. On cursory analysis of this study, when West Virginia is so well off, and Illinois is so low, it’s likely due to the amount of high wage earners. Illinois has Chicago and more billionaires than West Virginia, as well as plenty of poverty. So generally any state with the wealthiest people will generally appear to be worse. Note California and New York are similar to Illinois on the map, and in terms of big cities with billionaires and poor. Now this is a simplification, there are other factors which cause different states to show differently on this map, states can be very different.
Comment by mcb Monday, Jun 8, 15 @ 4:42 pm
Probably should have simplified more. Hot Rod analogy: Torque and Horsepower always cross at 5454 rpm’s, which confuses people. It’s not because of some weird law of physics, it’s simply because HP is a value calculated from torque. It’s a math issue.
Just like the shrinking middle class is a creation of the math used.
Comment by mcb Monday, Jun 8, 15 @ 4:45 pm
MCB, keep whistling past the graveyard, for what reason, I don’t know.
Household incomes for the 99% have been stagnant for 30 years, overall. Productivity has exploded during that time, but all the gains went to the 1%.
And state governments had virtually nothing to do with that at all.
Comment by Wordslinger Monday, Jun 8, 15 @ 4:52 pm
-wordslinger-
I stand by my analysis, but I completely agree with your last sentence.
Comment by mcb Monday, Jun 8, 15 @ 4:54 pm
Gov. Walker made a central pledge before his first term, namely that he would produce 250,000 new jobs within his first term. He said that pledge is what he should be judged by. He fell 100,000 jobs short, not close enough for hand grenades and horseshoes.
Comment by nona Monday, Jun 8, 15 @ 4:59 pm
- Nick Danger - so you think the decline in income started in 2010 and there was no dramatic increase in the income decline by implementation of Wisconsin Act 10. Given how dramatic the public sector wage decline has been I doubt it.
Comment by Rod Monday, Jun 8, 15 @ 5:35 pm
It is the members of the middle class, above definition makes sense, who ought to be paying attention and reading more.
Because both Team Rauner and the Democratic majority want more, more, more money out of all but the lowest earners, a great deal for the highest earners, and another slapdown for the middle class.
If you are in the Illinois middle class and you think that either Rauner or Madigan is interested in your welfare, you are so, so deluded.
Comment by Cassandra Monday, Jun 8, 15 @ 6:06 pm
The middle class has always been the cash cow.
Comment by AnonymousOne Monday, Jun 8, 15 @ 6:25 pm
@Dudeman, you are misreading and misrepresenting those statistics.
Comment by The Dude Abides Monday, Jun 8, 15 @ 6:43 pm
- mcb -
Again, the birth rate among the poor has always been higher than the birth rate of the more affluent. That has been true for all of American history (if you are unconvinced, see the last graphic on this Freakonomics link which charts this phenomenon going back to 1828: http://freakonomics.com/2011/06/10/the-rich-vs-poor-debate-are-kids-normal-or-inferior-goods/)
Regardless of this never ending poor people baby boom, medium income (adjusted for inflation) has increased. But it’s gone in the opposite direction the last 15 years or so. Why? Is it due to the severity of the Great Recession?
The question isn’t birth rate, it’s ecomomic mobility. All stats aside, when I was a kid, the McDonald’s in my neighborhood was staffed by teenagers. Today it’s staffed by the heads of households.
Comment by PTR Monday, Jun 8, 15 @ 7:00 pm
“Cheney-Bush Depression” really?
The Community Reinvestment Act which triggered the real estate market collapse was a product of the Democratic Party. Barney Frank was a champion of this unsound program of giving home loans to everyone.
Comment by Under Further Review Monday, Jun 8, 15 @ 7:55 pm
“You can’t cut your way to prosperity.”
Somebody needs to read the recent biography “Coolidge.”
Comment by Under Further Review Monday, Jun 8, 15 @ 7:58 pm
++Here’s a quote from the slate link from earlier:
“the rates of unplanned pregnancies and births among poor women now dwarf the fertility rates of wealthier women++
This is due to low income women not being able to afford birth control pills.
Comment by Mama Monday, Jun 8, 15 @ 8:31 pm
++The Community Reinvestment Act which triggered the real estate market collapse was a product of the Democratic Party. Barney Frank was a champion of this unsound program of giving home loans to everyone.++ You must be joking or smoking weed.
Comment by Mama Monday, Jun 8, 15 @ 8:48 pm
Pretty clearly caused by the off-shoring of manufacturing jobs and the de-unionization of the workforce….otherwise known as the Gospel According to Bruce.
YES!!!!!!!!!!!!!!!!
Comment by Illinois Manufacturer Monday, Jun 8, 15 @ 9:02 pm
UFR, not one subprime mortgage was brokered, sold, then bundled as part of a AAA security due to the CRA. That’s quite shocking coming from you.
There are shelves at your local library where you can get the skinny on rhe Moral Hazard created by the brokers, banks and rqting agencies, or you can review the multi-billion-dollar settlement agreements between the Justice Department and the banks.
Comment by Wordslinger Monday, Jun 8, 15 @ 9:06 pm
===“You can’t cut your way to prosperity.”
Somebody needs to read the recent biography “Coolidge.” ===
Ah yes, the guy who set the table for the Great Depression and whose determination to not spend money on national defense (and unsuccessful attempt to then force other powers to cut their defense spending) sent Anglo-American relations into a tailspin in the late 1920s. Yes, yes, let’s emulate that joker.
Comment by GraduatedCollegeStudent Monday, Jun 8, 15 @ 9:40 pm
The question is not whether many of these social programs are worthy-they are.
The question is, who pays what proportion of their wealth. In Illinois, with its flat tax, the middle class, dsspite its serious economic problems, is expected to bear the heaviest burden, while the burden of the wealthy is much, much lighter. But neither party seems to care.
Comment by Cassandra Monday, Jun 8, 15 @ 10:05 pm
UFR: The community reinvestment act, a product of the late 1970’s, had zero to do with the real estate crash. Some uninformed talkers on the far right came up with that one to move the blame from financiers in insurance companies and banks to liberals in government, and “those people” in poor neighborhoods.
Comment by walker Monday, Jun 8, 15 @ 10:58 pm
Note that this map is based on percentage change in wealth. West Virginia looks good because it was poor to begin with, and is still poor.
Comment by IllinoisBoi Tuesday, Jun 9, 15 @ 12:00 am
Also keep in mind that high wage earners keep paying a smaller and smaller percentage of the taxes nationwide leaving a bigger and bigger burden on everybody else. This is particularly true in Illinois with its regressive tax structure.
Comment by Carhartt Representative Tuesday, Jun 9, 15 @ 8:05 am
=Somebody needs to read the recent biography “Coolidge.”=
Usually to find Shlaes’ kind of fawning hero worship, you’d have to read an old Tiger Beat profile of Shaun Cassiday.
Comment by Carhartt Representative Tuesday, Jun 9, 15 @ 8:13 am
===Note that this map is based on percentage change in wealth. West Virginia looks good because it was poor to begin with, and is still poor.===
Exactly!
Comment by Anon Tuesday, Jun 9, 15 @ 8:26 am