Latest Post | Last 10 Posts | Archives
Previous Post: *** UPDATED x1 - Marwig responds *** McAuliffe’s oops on “W” mailer, Marwig whacked by Rosemont
Next Post: State senator announces Obama endorsement
Posted in:
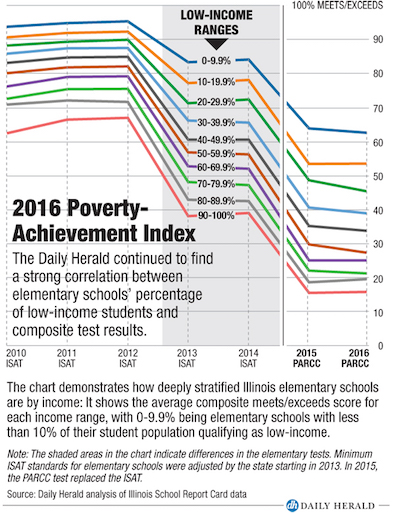
* The Daily Herald updated its Poverty-Achievement Index with new data from the Illinois State Board of Education…
Our analysis divides all elementary schools in the state into 10 tiers based on the percentage of low-income students a school serves. The zero to 9.9 percent tier includes schools serving the fewest low-income students, while those in the 90 percent to 100 percent range covers schools with the highest percentage of low-income students.
We then calculate the average percent met/exceeds for each tier. As in past years, our analysis shows how deeply stratified Illinois schools are by income, with no income tier performing better than any other tier with fewer low-income students.
Emphasis added.
* The chart…
* Meanwhile, from WBEZ…
The message parents should take from Monday’s newly released state report card data is that despite Illinois’ financial difficulties, school performance is steady — for the most part, according to state officials.
John Barker, the state’s new chief of performance, pointed out that overall graduation rates, attendance rates and ACT scores are either the same or up a little compared with last year.
Two areas of concern: Chronic truancy rates, which look at students who missed 5 percent or more days without a valid excuse, increased from 8.7 percent to 9.8 percent.
Also, the number of students in preschool went down by more than 12,000 children.
Preschool education is this governor’s specialty. He knows a lot about it, including the theories about how and why it works. So, it’s weird that the number of preschool kids dropped.
* More from the ISBE…
Students enrolled in Pre-K-12 education – more than two million students (2,041,779) at the beginning of 2015-16, 12,777 fewer than the previous year; percentage of Hispanic students increased slightly (25.1% to 25.5%), while percentage declined slightly for White (49.3% to 48.8%) and African-American (17.5% to 17.3%) students
*** UPDATE *** It looks like WBEZ and I both misread the ISBE numbers. Those are for all students, not just Pre-K.
posted by Rich Miller
Tuesday, Nov 1, 16 @ 10:45 am
Sorry, comments are closed at this time.
Previous Post: *** UPDATED x1 - Marwig responds *** McAuliffe’s oops on “W” mailer, Marwig whacked by Rosemont
Next Post: State senator announces Obama endorsement
WordPress Mobile Edition available at alexking.org.
powered by WordPress.
“despite Illinois’ financial difficulties, school performance is steady — for the most part, according to state officials.”
K-12 education funding has not been reduced during the budget standoff — in fact at has increased modestly. The folks at ISBE should know this.
Comment by Roman Tuesday, Nov 1, 16 @ 10:54 am
It would be interesting to see if there is a correlation between the drop in preschool enrollment, and the cuts to social service programs. Rauner can proclaim to be the education and economics governor, but by having “no social agenda”, he’s undermining his (and Diana’s) grand plan.
http://www.childaction.org/news/2012/ChildCare_KeyFacts-CA%20Budget%20Project.pdf
Comment by Anon221 Tuesday, Nov 1, 16 @ 10:58 am
OK. If I’m reading this right, under the current scoring system, in our BEST result schools Illinois is only averaging something like 63% achievement and our worst result schools something like 17% achievement as measured by this standardized test. Maybe I’m misunderstanding it, but that doesn’t seem like good results.
I realize the last two years are based on a different test, so you can’t necessarily compare with previous years. But if you look at the previous years where the test was supposedly the same, it looks like there was a decline there from 2012 forward. And it looks like there was mostly a decline between 2015 and 2016.
To this mostly uninformed observer, it looks like, on average and for whatever reason, the schools in Illinois are on the wrong track.
Comment by RNUG Tuesday, Nov 1, 16 @ 11:01 am
One huge factor(according to The Center for Public Education and Harvard University) that can predict student success in not the funding level of the schools, or the income characteristics of the students family, but rather it is the level of parental involvement in a students education. Some innovative and low cost solution’s are offered to parents by the Chicago Child-Parent Centers (CPC).
Comment by T Sowell Tuesday, Nov 1, 16 @ 11:14 am
There is nothing new in the ISBE data at all. The American Psychological Association in this brief statement https://www.apa.org/pi/ses/resources/publications/education.aspx explains the links between social economic status and educational performance. We have known this since the 1930s.
Comment by Rod Tuesday, Nov 1, 16 @ 11:17 am
“So, it’s weird that the number of preschool kids dropped.” You can’t look at it in a vacuum. Did the number of preschool children change in the general population? Gotta go to the census for that information.
Comment by NoGifts Tuesday, Nov 1, 16 @ 11:18 am
Does this surprise anyone? We know what drives poverty; single parent families do less well than two parent families, uneducated adults make less than educated adults. The same factors that drive poverty work against the children in poor families.
Comment by Last Bull Moose Tuesday, Nov 1, 16 @ 11:20 am
Quite a few parents had their students boycott the PARCC tests. Not sure if the number would be statistically significant but one could question whether many of those students who skipped it might have brought the achievement scores up.
Comment by Dance Band on the Titanic Tuesday, Nov 1, 16 @ 11:22 am
Today’s fact of the day from the Economist seems somewhat relevant:
“The average wage of a child-care worker in America is less than that of a dog walker.”
Comment by 47th Ward Tuesday, Nov 1, 16 @ 11:24 am
You mean poverty is the cause of low academic achievement - not lazy “virtually illiterate” teachers? D-u-u-u-h!
Reading comprehension is more than just decoding. Without vocabulary and background knowledge, you might as well be reading a foreign language..
Here’s the problem.
The 30 Million Word Gap:
https://www.aft.org/sites/default/files/periodicals/TheEarlyCatastrophe.pdf
Comment by TinyDancer(FKASue) Tuesday, Nov 1, 16 @ 11:25 am
Rich - WBEZ got the preschool decline number completely wrong. ISBE was reporting an overall decline of 12,000 kids across Prek-12. They said nothing about a decline in preschool - in fact, it’s most likely gone up.
The bullett point you posted actually makes that point.
Students enrolled in Pre-K-12 education – more than two million students (2,041,779) at the beginning of 2015-16, 12,777 fewer than the previous year; percentage of Hispanic students increased slightly (25.1% to 25.5%), while percentage declined slightly for White (49.3% to 48.8%) and African-American (17.5% to 17.3%) students
Comment by Short but Slow Tuesday, Nov 1, 16 @ 11:31 am
I question the validity of some of these tests. Depending on the test design, results are easily manipulated. Graduation rates, also.
We HAVE a national achievement test. No one knows ahead of time who is going to take it, so there’s no time or money wasted on test-prep.
What was wrong with The National Assessment of Educational Progress (NAEP)?
http://nces.ed.gov/NationsReportCard/
Comment by TinyDancer(FKASue) Tuesday, Nov 1, 16 @ 11:40 am
What are we to take from this? Here is my take; the probability of a low income student being successfully educated in the present system is very very low. Then why are we wasting our time and money? And, this is not a slam on teachers. The numbers, someone commented (paraphrasing) “unchanged since the 30’s,” speak for themselves. So, continued reliance on existing practices would appear to satisfy the definition of insanity. Radical change is badly needed.
Comment by Keyser Soze Tuesday, Nov 1, 16 @ 12:28 pm
The same ‘message’ that educational achievement is related to poverty is the same message the educational establishment has been giving for the last 50 years. It really doesn’t wash.
Never any real attempts to explain the underlying causes are elusive at best, and no, the APA study does not do that either.
The reasons are so complex that it defies any solid explanation despite attempts to do so. Certain high illegitimacy rates and the massive importation of poor immigrants, heavily Hispanic, do not hope test scores.
Just blaming the teachers, at least as a whole, is ridiculous. Better look at the parents and find the real causes.
Many of the schools where achievement is low is not the result of overall poor educational funding as there are to many exceptions on a statewide basis. One can cherry pick a school where achievement is not as high as some other school where funding is higher and say, see there is the answer. But then another person can point to a school where achievement is higher and expenditures are lower.
Again, the information trotted out by the educational establishment keeps being put out year after year after year after year. In and of itself it means nothing. And the issue is to hot to handle in any direct meaningful way.
Comment by Federalist Tuesday, Nov 1, 16 @ 12:45 pm
=K-12 education funding has not been reduced during the budget standoff — in fact at has increased modestly=
For some. Not nearly all.
For starters, Mandated Categoricals or MCAT’s(30% of our state funding) has been and continues to be prorated. On top of the reduced funding, we are not getting all or our payments. Most of us received 40% of our transportation funding. For rural districts that are large in geography but low density, that has been a killer.
Much of the increase in funding has gone to high poverty districts (at the expense of the middle class districts) and pre-k.
While the overall numbers might be higher, the distribution has not equally impacted everyone.
In addition, the foundation formula basis ($6119) has not changed since FY 10.
PARCC has yet to be proven valid or reliable. The rollout has been a disaster and technical problems persist. We only received data in October after giving the test in March.
And..no duh on poverty. e only have decades of research on the subject.
Comment by JS Mill Tuesday, Nov 1, 16 @ 12:49 pm
To consider RNUG and Tiny Dancer (FKA Sue) as I comment. These are the issues K-12 has been trying to manage. Please hang with me.
It began when No Child Left Behind was implemented as states had to implement an assessment for Math and Reading/English Language Arts for each grade 3-8 and once in high school. The federal government said specific percentages of each state’s students had to meet the state’s cut scores (score at which a student would be declared meeting or exceeding) for them to say the state was making Adequate Yearly Progress (AYP). If you didn’t make it your funding could be cut. Illinois created the Illinois State Acheivement Test (ISAT) and has played with the cut score several times before it was retired a few years ago. This caused it to look like anywhere from 60-80% of kids were “passing” because they met the cut score set by ISBE.
The National Assessment of Educational Progress (NAEP) is given to a representative sample of each state’s student population. It has been a very consistent marker of student performance and is how people started finding the issue of states playing with cut scores across the country. (Trust me Illinois is not the only state who did this.) The NAEP Scores are generally about 1/3 of students are rated meeting/exceeding. The really interesting part is when you look at where the PARCC scores have come in, they finally are closer to the NAEP. (Not to say there are not issues with PARCC.)
If anyone is really interested in the issue comment below and I will some how try to find you. There are some good graphics. Look for research done by Paul Zavitkovsky from the University of Illinois at Chicago. He has done considerable quality research on this issue and can provide some context.
Comment by Oh. Goodness Tuesday, Nov 1, 16 @ 12:53 pm
===Certain high illegitimacy rates===
Isn’t that a factor in poverty? You’re woefully misinformed if you do not believe the link between poverty and lower academic achievement. There must be some other reason that prevents you from trusting in data that show, over and over again, that students from poor homes do worse in school than children from higher income homes.
And your off-topic tangent about school funding inequity tells me all I need to know why you don’t believe this data. You must be from the Arizona Bob School of Public Education Haters.
Comment by 47th Ward Tuesday, Nov 1, 16 @ 12:56 pm
So, we’re just not gettin’ this. It’s not the “system.”
It’s what happens before the kids even get into the “system.”
It’s institutional racism. It’s generational poverty.
The parent is the child’s first teacher.
So, the earlier we can get to these kids AND their parents - early childhood education, wrap-around services, job training/tutoring for the parents - the better.
These parents/kids need support practically at the time of birth.
But this costs money. And some would rather just invest in prisons and charter schools/ test publishers. Good for the prison/charter school industry/Pearson. Not so good for the kids.
Comment by TinyDancer(FKASue) Tuesday, Nov 1, 16 @ 1:04 pm
When parents can only afford one winter coat to be shared between two (or more) children, does missing school because it’s not your turn to wear it count as a valid excuse to miss school?
Because it happens.
Comment by Cheryl44 Tuesday, Nov 1, 16 @ 1:08 pm
Cheryl: You have identified a fixable problem.
Comment by Keyser Soze Tuesday, Nov 1, 16 @ 1:44 pm
I understand child care vouchers were cut as part of child care. I know many parents utilized Pre-K through their child care provider and not through Head Start or PK through public schools. That could impact the number of kids enrolled in PK.
I agree with RNUG’s comments. The results, overall, show a depressing trend.
State funding has not increased at every school district and it isn’t fully funded. Special education, transportation and free/reduced lunch are still pro-rated. Furthermore, re-allocation for general state aid within the funding formula impacted some schools.
Comment by Fairness and Fairness Only Tuesday, Nov 1, 16 @ 1:45 pm
To the update on my previous comments:
It would be interesting to see if there is a correlation between the drop in (remove-preschool enrollment) (insert- test scores while taking into account the change in the tests used), and the cuts to social service programs. Rauner can proclaim to be the education and economics governor, but by having “no social agenda”, he’s undermining his (and Diana’s) grand plan.
Comment by Anon221 Tuesday, Nov 1, 16 @ 1:53 pm
As to the relationship between poverty, education spending, and student outcomes here is an excellent study done by CTBA a few years ago
http://www.ctbaonline.org/reports/money-matters
Comment by steve schnorf Tuesday, Nov 1, 16 @ 2:01 pm
sorry, relationship “among”….
Comment by steve schnorf Tuesday, Nov 1, 16 @ 2:25 pm
@47th Ward
‘Isn’t that a factor in poverty? You’re woefully misinformed if you do not believe the link between poverty and lower academic achievement’
I agree very much there is a very high relationship between poverty and academic achievement. And in no way did I say otherwise if you read what I stated.
‘One’ of my points is that high illegitimacy rates are highly correlated to poverty and that this is a factor in those achievement scores. That school spending alone is not the answer nor is blaming the teachers.
It appears that you wanted to read something into my comments because of your personal views that I did not state.
Comment by Federalist Tuesday, Nov 1, 16 @ 2:33 pm
Mr. Schnorf, I believes you’re pore routes is a-showin’. /s
Comment by Whatever Tuesday, Nov 1, 16 @ 2:37 pm
Sorry if I wasn’t clear Federalist. I was really trying to respond to your opening statement:
===The same ‘message’ that educational achievement is related to poverty is the same message the educational establishment has been giving for the last 50 years. It really doesn’t wash.===
You must also believe the science on climate change doesn’t wash either. When you question something so easily proven, repeatedly, over decades, and attempt to dismiss it as the work of the “educational establishment,” it leads me to believe you have a partisan lens that facts and logic cannot penetrate.
Comment by 47th Ward Tuesday, Nov 1, 16 @ 2:52 pm
>>It’s generational poverty…The parent is the child’s first teacher. So, the earlier we can get to these kids AND their parents - early childhood education, wrap-around services, job training/tutoring for the parents - the better.
These parents/kids need support practically at the time of birth.
Amen, though I think services are needed even before birth. Some social services yield immediate results; some, like what is needed here, are more like infrastructure spending, with impact over longer periods of time.
Comment by Earnest Tuesday, Nov 1, 16 @ 2:58 pm
==hat students from poor homes do worse in school than children from higher income homes.
Yep. There’s a solution to this too for the those in poverty. Move them out of poverty with income supports. Or we can talk radical change with no actual idea of how that would improve anything.
Comment by ArchPundit Tuesday, Nov 1, 16 @ 3:03 pm
—Again, the information trotted out by the educational establishment keeps being put out year after year after year after year. In and of itself it means nothing. And the issue is to hot to handle in any direct meaningful way.
You do realize there is an entire scientific literature on this don’t you? It’s not just some idea that people threw out there for discussion.
Comment by ArchPundit Tuesday, Nov 1, 16 @ 3:04 pm
Milton Friedman believed that money transfers could end poverty. Problem is that unless skills are gained, poverty returns.
The parent that cannot do basic math cannot teach math. The parent that reads at a 3rd grade level has trouble teaching reading. The parent that never acquired the habit of punctuality will not pass that habit to their child.
Wraparound services can do some good some times. But they are not always effective.
Comment by Last Bull Moose Tuesday, Nov 1, 16 @ 3:20 pm
@47th Ward.
Yes, my statement was very poorly worded. The statistical relationship shows a high correlation between poverty and test scores. What I was trying to get at (and I did a poor job) was that just spending more money, as the educational establishment so often claims, misses the reality that some schools spend far less than others with better ‘results.’ This is often true, particularly in more rural areas, where poverty rates are high but test scores are run closer to average or even above.
FYI. I taught in the public schools for two years, and was a faculty member at a state university for 29 years. I have seen and experienced a lot over a number of decades.
Comment by Federalist Tuesday, Nov 1, 16 @ 3:23 pm
= This is often true, particularly in more rural areas, where poverty rates are high but test scores are run closer to average or even above.=
There is a distinct difference between urban poverty and rural poverty.
Interestingly, those living in rural poverty often have less access to services due to the nature of population concentrations in rural areas.
Those living in urban poverty have far greater (Illinois in 2016 has experienced a definitive diminished due to our governors approach to social services) access to services and this has an impact on schools. Urban schools with high poverty concentrations also receive significant federal dollars layered on top of local and state dollars. This money is direct (Title 1) and indirect (other services provided by state, local and federal govt.).
Both are unique (types of poverty) in their needs, but similarities exist as well. The concentration of poverty significantly increases difficulty in remediation.
Comment by JS Mill Tuesday, Nov 1, 16 @ 3:35 pm
===What I was trying to get at…was that just spending more money…===
That’s fair. Thanks. I’d prefer we stick to the subject, that poverty of the student leads directly to poor educational outcomes and focus on ways we can reduce the number of poor students. The debate about how much is spent per-pupil isn’t terribly helpful in that regard.
What is helpful is a much better understanding of poverty, its causes and the ways in which it can be alleviated for some families. We spend too much time focusing on symptoms, not enough time focusing on the underlying disease in my opinion.
Comment by 47th Ward Tuesday, Nov 1, 16 @ 3:45 pm
@47th Ward,
“What is helpful is a much better understanding of poverty, its causes and the ways in which it can be alleviated for some families. We spend too much time focusing on symptoms, not enough time focusing on the underlying disease in my opinion.”
Agreed, but of course there is the distinct possibility that different people will come to different conclusions on cause and effect.
Comment by Federalist Tuesday, Nov 1, 16 @ 4:18 pm