* Joe Mahr has a stats-packed piece in the Tribune today about excess deaths…
Looking at federal estimates of excess deaths — how many more people died than is usually expected — Illinois ranked among the 10 worst states (including the District of Columbia) for the 10-month period from March through December.
In Illinois, nearly 111,000 people died from March 1 through Jan. 2, as tallied on a weekly basis by the Centers for Disease Control and Prevention. That’s 27% higher than the average for 2015 through 2019, which was about 87,000 deaths for the same 44-week period. […]
The hardest hit may not be a surprise — it’s New York — because of the massive number of deaths there during the first wave. Even with generally milder stretches later in 2020, New York state saw an increase in deaths of nearly 37% during the last 10 months of 2020. […]
The data suggests it’s because Illinois, unlike most places, suffered not one but two significant waves, and deaths were still higher than normal in between. […]
And then came the fall, when Illinois saw an even deadlier wave, with death figures from mid-November to mid-December hovering between 50% to 60% more deaths than average. This surge was broader, across the entire state
Too many people and, more importantly, local government officials outside Chicago and Cook County figured that since they were relatively safe during the first wave they didn’t have to worry about a second wave. Deadly consequences.
* You really should go read the whole thing, but here are a few charts…


If you have questions about the charts, click here and look them up in the article.


- Sir Reel - Thursday, Mar 11, 21 @ 10:42 am:
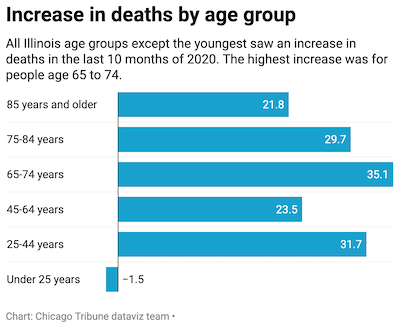
2 interesting findings are death by race, with the significant Hispanic rate, and death by age, with the surprisingly high rate for 25-44.
And I agree with Richard about local government officials. They tend to be of the go-along-get-along variety.
- Candy Dogood - Thursday, Mar 11, 21 @ 10:50 am:
I can save some people sometime, the Tribune associates the increase in deaths that are not confirmed COVID-19 cases by blaming the shut down causing people to “not venture out to receive medical care” because the Chicago Tribune is still the Chicago Tribune.
There’s also been more than 6,000 additional confirmed COVID-19 deaths since their cut off in January, and they cut off their review of 2021 so far on February 20th because of limitations of other data and fail to mention the more than 2,000 more deaths that have occurred since February 20th.
- SWIL_Voter - Thursday, Mar 11, 21 @ 10:58 am:
One thing I can’t quite wrap my head around is how high the death rate went up, obviously because of COVID, but how flu cases and deaths were way down. Is it just the newness of COVID? I’d think flu-avoiding behavior and COVID-avoiding behavior are the same. But maybe we’re just less susceptible to flu? This might be a dumb question sorry
- Proud Papa Bear - Thursday, Mar 11, 21 @ 11:38 am:
SWIL - not a dumb question. Statistically, if say 5% of people get the flu in a year but take preventative measures that could reduce flu to 3%.
Meanwhile, COVID, being a novel virus went from 0% to its current rate. Over time they’ll even out somewhat or COVID could overtake influenza if it is more contagious.
- Homebody - Thursday, Mar 11, 21 @ 11:41 am:
I find the lower deaths for under 25 interesting. Is it just because lots of things were closed, and people were traveling less, so we ended up with fewer traffic fatalities, fewer DUIs, etc?
- Rich Miller - Thursday, Mar 11, 21 @ 11:45 am:
Homebody, what did I say about questions on the graphs?
- Lincoln Lad - Thursday, Mar 11, 21 @ 11:50 am:
The disinformation campaign throughout the virus has killed so many, yet so many refuse to see what is obviously there.
- Chicago Cynic - Thursday, Mar 11, 21 @ 12:10 pm:
All those people who continue to claim the deaths are overblown and Covid is largely a hoax are truly delusional. It’s been an awful year of horrific tragedy. Wish we could put all the extraneous nonsense in the rear view.
- Homebody - Thursday, Mar 11, 21 @ 12:24 pm:
Unfortunately I’m not currently a Tribune subscriber, and I feel bad about dodging paywalls, so I didn’t bother to try to click through. if the article provides this information, I apologize. It was mostly just idle musing on my part.
- tea_and_honey - Thursday, Mar 11, 21 @ 12:27 pm:
Is there a non-paywalled way to see more of the charts?
- Rich Miller - Thursday, Mar 11, 21 @ 12:37 pm:
===Is there a non-paywalled way===
Just pay the subscription, for crying out loud.