Our sorry state
Tuesday, Aug 16, 2016 - Posted by Rich Miller
* Governor Rauner has often said, “I can’t find a year when we’ve had a balanced budget in Illinois.”
He may not be wrong. From Thomas Walstrum, a business economist at the Federal Reserve Bank of Chicago…
Illinois’s fiscal crisis has been a long time coming. From the late 1980s on, Illinois has spent more than it has collected in revenues. And while the typical U.S. state has also generally spent more than it has collected, Illinois’s overspending has outpaced the national average since the mid-1990s, primarily through pension spending. How could Illinois get away with this for so long when it is required by law to have a balanced budget? Over the years, lawmakers used a variety of techniques to put off paying the bills, including underpaying into the pension systems. Such techniques can work for only so long, and Illinois is now coming to terms with over 20 years of poor fiscal performance.
* Drill down a bit…
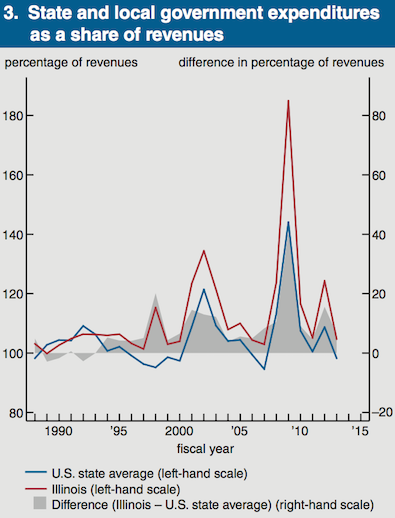
Figure 3… shows that starting in the mid-1990s, Illinois began spending a greater percentage of its revenues than the average U.S. state. In addition, since the late 1980s, Illinois has been spending more than 100% of its revenues, meaning it hasn’t had a truly balanced budget for well over two decades and has been accumulating debt.
* Figure 3…

Keep in mind that the difference between spending and revenues in Illinois shot way back up in Fiscal Year 2015 and 2016 because of the partial expiration of the income tax hike without many cuts.
* OK, back to the narrative…
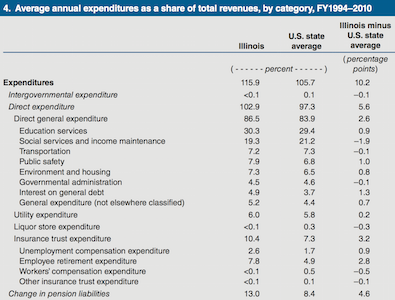
How, specifically, has Illinois overspent relative to its revenues? To shed light on this question, I look at expenditures by category, as classified by the Census Bureau, for Illinois versus the average U.S. state during FY1994–2010 (Illinois’s overspending became markedly higher than that of the typical U.S. state in FY1994, and Illinois raised taxes in FY2011). For those 17 years, I calculate the average of yearly expenditures as a percentage of total revenues. Figure 4 shows that over those years, Illinois’s spending averaged 115.9% of its revenues compared with 105.7% for the typical U.S. state.
Thus, while spending outstripped revenues for both Illinois and the typical state during this span, Illinois overspent by much more (10.2 percentage points). The top two categories on which Illinois spent more were the change in pension liabilities (4.6 percentage points more) and employee retirement (2.8 percentage points more). Pension-related spending, then, makes up almost three-quarters of the difference between Illinois’s spending and that of the typical state.
Illinois also spent 1.3 percentage points more of its revenues on general debt interest than the average state—a sign that Illinois was accumulating debt outside of its pension system as well.
* Figure 4…

And, again, keep in mind that this doesn’t take into account our current fiscal nightmare.


- The Captain - Tuesday, Aug 16, 16 @ 2:36 pm:
Yeah, in 1995 they passed a pension funding plan and actually started paying into the pension system.
- Jeff Trigg - Tuesday, Aug 16, 16 @ 3:04 pm:
This is the answer to your question, what was Madigan’s biggest mistake. Debts. Passed on to the next generations.
- Last Bull Moose - Tuesday, Aug 16, 16 @ 3:19 pm:
Would like to see these numbers as a % of state GDP. Were simply not taxing enough or were we spending at a higher rate than comparable states? It would be even more useful if we could include spending by all units of government. In Illinois we fund most schools through local property taxes so the State government numbers might look low.
- Chicagonk - Tuesday, Aug 16, 16 @ 3:27 pm:
So in other words, unfunded pension and retirement healthcare liabilities that we collectively ignored as a state.
- Anony - Tuesday, Aug 16, 16 @ 3:30 pm:
Agree Moose. Let’s see the numbers of all taxes paid in to all state and local governmental units, including sales taxes. Do the same for spending. Then compare to other states, both in total and on a per resident basis.
- D.P. Gumby - Tuesday, Aug 16, 16 @ 3:38 pm:
He certainly hasn’t proposed one!
- Last Bull Moose - Tuesday, Aug 16, 16 @ 3:57 pm:
Thanks Anony. We need the GDP per capita as well. Illinois is a high per capita GDP and high per capita cost state. Simply comparing dollars spent will not give a good picture.
- Lucky Pierre - Tuesday, Aug 16, 16 @ 4:14 pm:
Madigan’s legacy is lowering the wages and standard of living of future Illinois residents to pay for votes today
- Norseman - Tuesday, Aug 16, 16 @ 4:17 pm:
I’m curious to hear Steve Schnorf’s reaction to this piece. He’s certainly has a lot of experience in this area.
- Anonymous - Tuesday, Aug 16, 16 @ 4:56 pm:
I note that this pattern started under Jim Edgar, who I maintain was an overrated governor. As for Madigan, he wasn’t exactly happy about this turn when it happened, but when his concerns on pension funding were rebuffed by other top politicians in the mid 1990s, he probably should have resigned instead of quietly throwing in the towel. As it is, he’s ended up jointly owning the crisis by his silence.
- Angry Chicagoan - Tuesday, Aug 16, 16 @ 4:59 pm:
That anonymous from 4:56pm is me. Looks like my browser is no longer automatically populating the Nickname line.
- Stark - Tuesday, Aug 16, 16 @ 5:56 pm:
-Lucky Pierre-
Speaker Madigan and the employees’ wages he controls. Give me a break.
- Ron - Tuesday, Aug 16, 16 @ 6:25 pm:
Illinois has the third highest state and local tax burden in the nation. Wake up folks, our taxes are outrageous already
- Andy S. - Tuesday, Aug 16, 16 @ 8:10 pm:
The original article’s figures 1 and 2, which are omitted above, are by far the most significant. What they show is that in every single year between 1989 and 2013, as a percentage of gross state product, both state and local spending and revenue were lower in Illinois than the national average. So yes, Illinois overspent relative to the paltry revenues it was collecting, but the main issue was undertaxation. Other things held constant, had Illinois’ combined state and local revenue as a % of GSP been in line with the national average, it would have run surpluses in most years and the pensions today would most likely be adequately funded.
- NoGifts - Wednesday, Aug 17, 16 @ 8:06 am:
Ron- it looks like Illinois is #10. That’s about 20% down the list. https://wallethub.com/edu/states-with-highest-lowest-tax-burden/20494/