COGFA’s latest pension report
Friday, Dec 5, 2025 - Posted by Rich Miller
* COGFA’s latest pension report gives us the ramp in a nutshell…
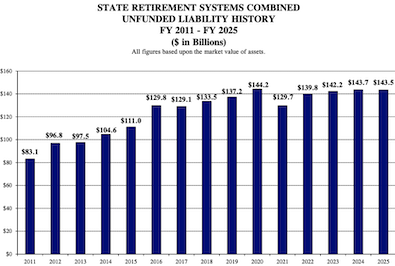
Chart 1 on the following page shows a 15-year history of the cumulative unfunded State pension liability and is based upon calculations performed by the retirement systems’ actuaries using the market value of assets for all years, including FY 2025. Overall, the aggregate unfunded liability has grown significantly over the past 15 years from $83.1 billion in FY 2011 to $143.5 billion in FY 2025.
Since the enactment of P.A. 88-0593 in FY 1996—commonly known as the 1995 funding law, which created the 50-year funding policy that governs annual required State pension contributions—the primary driver behind the growth in the combined unfunded liability has been actuarially insufficient State contributions determined under the current pension funding policy in P.A. 88-0593. As the actuaries for the State retirement systems have noted in their respective annual actuarial valuation reports, the funding plan under P.A. 88-0593 produces employer (State) contributions that are typically below what is considered actuarially adequate. As a result, the aggregate State contributions have historically not been sufficient to stop the growth in the combined unfunded liabilities, even under a hypothetical scenario in which all other actuarial assumptions were met. (Table 5 in a later section compares the statutory State contributions with Actuarially Determined Contributions (ADC).) Hence, there is a distinction between contributions that are statutorily sufficient and contributions that are considered actuarially sufficient. The annual reports of the State Actuary have noted this distinction as well
* Chart 1…
Narrative…
Over the recent five-year period, the unfunded liability on the market value of assets has increased from $129.7 billion in FY 2021 to $143.5 billion in FY 2025. In FY 2021, the unfunded liability saw a significant improvement, due in large part to exceptional investment returns across all systems. However, it has gradually risen again since then. Poor investment performances—below 0% on a market value basis from all systems in FY 2022—added upward pressure on the unfunded liability, and higher-than-projected salary increases across all five systems in FY 2023 also contributed to an increase as well. In FY 2024, the unfunded liability rose slightly to $143.7 billion, nearing its previous peak again. While all systems achieved investment returns above their assumed rates of return on a market value basis, which helped contain the growth of the unfunded liability, it was not enough to prevent it from increasing. Changes in actuarial assumptions by TRS and SURS were among the main factors contributing to the increase, as well as to higher-than-assumed salary increases from all five systems.
* Some progress on whittling down the unfunded liability…
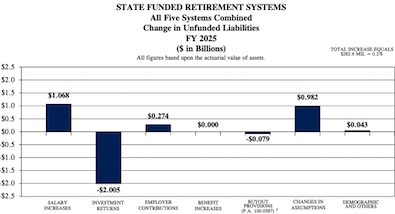
Specifically, SERS, JRS, and GARS have experienced actuarial gains from employer (State) contributions, meaning their actual State contributions have been sufficient to cover both the normal cost and the interest on the unfunded liability—a pattern that differs from historical experience. SERS experienced these gains from FY 2022 through FY 2025; JRS from FY 2021 through FY 2025; and GARS from FY 2020 through FY 2025. However, actuarial losses from TRS and SURS offset these gains, resulting in net actuarial losses from State contributions across the combined five systems, including in FY 2025.
State payments into the pension systems are projected to increase by a bit over $200 million next fiscal year.
* Buyout program…
(T)he “Big 3” systems’ buyout programs and salary-increase experience have reduced the unfunded liability by $1.528 billion and $1.466 billion, respectively. Although higher-than-assumed salary increases have generated actuarial losses in the most recent six years—particularly during FY 2023 through FY 2025— the cumulative effect since FY 1996 has resulted in a net actuarial gain
* More…
The two primary contributors to the FY 2025 increase were higher-than-assumed salary increases ($1.068 billion) and changes in actuarial assumptions ($982 million), which together increased the unfunded liability by $2.050 billion. While all five systems experienced salary increases above their assumptions, SERS and TRS accounted for most of the actuarial loss, with SERS contributing $573.9 million and TRS contributing $399.4 million. Regarding assumptions changes, only SERS, JRS, and GARS updated their economic and demographic assumptions—including inflation rates, general payroll increases rates, and retirement rates, among others. SERS also updated its assumed participation rate in the total buyout program from 3% to 4%. Of the $982 million attributable to assumption changes across these three systems, $963.2 million (98%) came from SERS, largely reflecting the significantly larger size of SERS relative to JRS and GARS.
However, the increase in the unfunded liability was largely offset by $2.005 billion in actuarial investment gains, resulting in a modest net increase. As mentioned earlier, all five systems experienced actuarial investment gains in FY 2025, with TRS accounting for $1.519 billion (76%) of the total.
* Related chart…


- May soon be required - Friday, Dec 5, 25 @ 2:37 pm:
Why was the SURS investment return for 2025 so much lower than the other systems?
- Davos - Friday, Dec 5, 25 @ 2:51 pm:
=Why was the SURS investment return for 2025 so much lower than the other systems?=
SURS’ allocation to equities is lower than the other systems.
- Michael - Friday, Dec 5, 25 @ 3:33 pm:
The past 15 years have seen historic increases in the stock market. The fact that pension deficits have grown alongside a period of “best case scenario” investment returns is remarkable. If–when–the stock market drops for 2 or 3 years straight, the game will be up.
- Six Degrees of Separation - Friday, Dec 5, 25 @ 3:44 pm:
===the game will be up===.
Nope, the game will be made longer if that happens.
- Anyone Remember - Friday, Dec 5, 25 @ 4:01 pm:
While the pension damages caused by Walker & Thompson, separately, were worse, the Edgar Pension Ramp was the worst single pension action in Illinois’ history. One fell swoop vs. thousands of nicks.
- Flyin' Elvis'-Utah Chapter - Friday, Dec 5, 25 @ 4:21 pm:
“the game will be up.”
Man, I’ve been listening to that shuck and jive for over 30 years.
If that game is up, the whole magilla is up as well.
- Rich Miller - Friday, Dec 5, 25 @ 4:33 pm:
=== I’ve been listening to that shuck and jive for over 30 years===
Some people openly want it to happen as punishment for… something.