* From the Pew Charitable Trusts…
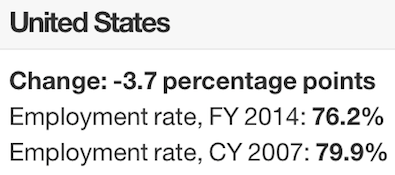
Employment rates for 25- to 54-year-olds were lower in 29 states in fiscal year 2014 than in 2007, before the Great Recession. In 2007, 79.9 percent of people ages 25 to 54 in the United States had a job. In the 12 months ending June 2014, five years after the recession ended, only 76.2 percent of people in that age group were working.
* Methodology…
Pew weighted data from the Current Population Survey using values provided by the U.S. Bureau of Labor Statistics. These data were used to calculate the total number of civilian, noninstitutionalized 25- to 54-year-olds in each state and in the nation. Pew then calculated the average percentage of people who were employed in each of those populations. These calculations were done for 2007 (January through December) and fiscal 2014 (July 2013 through June 2014). Pew used these values to calculate the percentage-point change from 2007 to fiscal 2014. Significance tests were performed to determine which changes were statistically significant at a 0.05 level.
The top five states, in order were Vermont, Nebraska, Minnesota, Massachusetts and Alaska.
* US average…
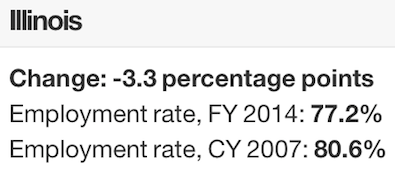
* Illinois actually did a little bit better than the national average…
* Meanwhile, we already discussed this hyperbolic statement by Bruce Rauner’s campaign today…
“Tens of thousands of people are giving up looking for work because of Pat Quinn’s failed policies,” Rauner said. “More than 63,000 people have given up hope on finding a job since April and Pat Quinn is out celebrating – it’s downright offensive to struggling families around Illinois.”
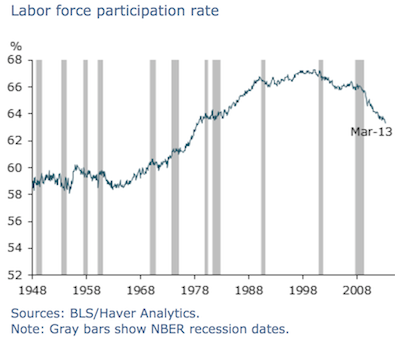
* So, I went looking through various Federal Reserve Board publications to see what their explanation was. Let’s start with this chart from the San Francisco Fed…
* James Bullard, President and CEO, Federal Reserve Bank of St. Louis, explained the history back in February…
If you know only one aspect of the data on labor force participation, it should be this: Labor force participation used to be relatively low, it rose during the 1970s, 1980s and 1990s, peaking in 2000, and it has generally been declining since 2000. […]
After about three decades of trending up, the labor force participation rate peaked in the first half of 2000 at 67.3 percent. The rate of increase was slower in the 1990s than it was in the 1970s or 1980s. The peak was more than 8 percentage points higher than the average level during 1948 - 1966. Many of the studies of labor force participation during this period focused on the increasing participation rates of women. However, whatever effects came from that source, or any other source, the labor force participation rate could not continue to increase forever. Households are making choice s about how much labor to supply given current wages and work environments, and women newly joining the labor force would find the right level of participation and stop there.
Since 2000, the labor force participation rate has generally been declining. The pace of decline was particularly sharp during the recession of 2007 - 2009, but the participation rate also declined steadily in the early 2000s and since the end of the recession in mid - 2009. […]
According to BLS projections, more than 70 percent of this decline is due to pure demographic factors; that is, changes in population shares by age groups, assuming unchanged participation rates for each group.
* By Willem Van Zandweghe at the KC Fed…
The primary factor behind this decline is the rising share of older workers in the population as the baby-boom generation ages and life expectancies increase. The rising share of older workers pulls down the LFPR because older workers have lower participation rates than prime-age workers. A second factor behind the gradual decline of the LFPR has been a steady reduction in labor force participation among young people over the last decade, resulting in large part from rising school enrollment
* Shigeru Fujita, of the Federal Reserve Bank of Philadelphia, February 6, 2014…
Nonparticipation due to retirement did not rise until the end of the Great Recession but started to increase significantly in 2010. Since the start of 2012, it has been the most important contributor to the increase in the overall nonparticipation rate.
* Washington Post…
Americans over the age of 65 are much less likely to work than prime-age Americans. And since that subset of Americans is swelling, that drives the labor-force participation rate down. Note that this is happening even though older Americans are staying on the job for longer than they did during the 1990s.
* And the Chicago Fed predicted more declines in the labor force through 2020…
Roughly two-thirds of the decline is due to the aging of the labor force (in particular, baby boomer retirements)
…Adding… Last year, when Illinois’ unemployment rate was really high, Bruce Rauner focused heavily on the rate. Now, of course, he’s saying the rate doesn’t matter. A few quotes sent over by Gov. Quinn’s campaign…
“Unemployment is awful. But in Danville, Decatur, and Rockford and other places, unemployment is well over 10%. These places share one common need: Jobs - and we need leaders who have experience in creating them.” -Rauner FB Post, 3/10/2013
“Under Pat Quinn we have become hostile to business and have moved up to one of the highest unemployment rates in America. We use to be leading the nation in economic growth and now we are at the bottom.” -WLDS, 8/15/14
“Rauner told the crowd he wants to bring his success in business to Springfield. In the process, his focus is to achieve results that will point to Illinois having the best schools and “the lowest unemployment in the country as opposed to the third highest” -SIOR-AIRE Meeting, 5/27/14
…Adding More… Greg Hinz…
For instance, the share of Illinois adults in the workforce dropped a whopping 4.1 percentage points in the past six years, slipping to 64.7 percent from 66.8 percent. Not good. But in Michigan and Ohio, the slippage was a statistically indistinguishable 3.9 percent each. And their current participation rates remain well under ours, at 60.4 percent and 62.8 percent, specifically.