* Bernie…
A poll in the 99th House District commissioned by Democratic challenger TONY DelGIORNO has him within five points of Rep. SARA WOJCICKI JIMENEZ, R-Leland Grove.
The automated telephone poll of 617 voters taken Oct. 6-7 by Public Policy Polling of Raleigh, North Carolina, has Jimenez with 43 percent to 38 percent for DelGiorno and 19 percent unsure. The margin of error is 3.9 percentage points. The firm works for many Democrats.
Respondents self-identified as 44 percent Republicans, 28 percent Democrats and another 28 percent independent or with another party. Just a quarter have a labor union member in their household.
DelGiorno, of Springfield, said his campaign got results about 7 p.m. Oct. 7 — just hours after news broke of GOP presidential candidate DONALD TRUMP’s 2005 lewd comments about women. Thus, it appears that the big story of the weekend probably didn’t affect the numbers much, if at all. The poll had Trump leading Democratic candidate HILLARY CLINTON 46-41, with 7 percent for someone else and 5 percent undecided.
Asked about their views on the candidates in the 99th, the tally on Jimenez was 35 percent favorable, 33 percent unfavorable and 31 percent not sure. DelGiorno’s numbers were 31 percent favorable, 27 percent unfavorable and 42 percent not sure.
Mitt Romney won that district 57-41 four years ago, so most assumed this would be a straight uphill climb for the Democrat DelGiorno. But there are tons of AFSCME members in the 99th. And it pains me to no end to write this, but we’re talking about a white-dominated Downstate district in the Year of Trump’s Wall and a legislator with a Latino married name. Ugh, that was hard to say, especially since I live in her district and I’ve known Sara for a very long time. But there’s just no getting away from it this year. The hate has been ginned up like we haven’t seen in a long while.
Even so, DelGiorno’s got a ways to go before he wins and he doesn’t yet have the cash.
Also, I’ve noticed a stark difference in polling results from both sides this year. It could be the different turnout models they’re using. So, maybe this PPP poll is just way off. We’ll all know for sure in less than a month.
* But there may also be something else going on. FiveThirtyEight published a study of every county in the country this week. As we all know by now, Hillary Clinton is doing better than previous Democrats with minorities and college-educated whites, while Donald Trump is doing better than previous Republicans with non-college-educated whites…
To get a handle on how these shifts could affect the electoral landscape, we modeled how many of Romney’s votes came from college-educated whites and minorities and how many of Obama’s votes came from non-college-educated whites in each state, county and congressional district. The difference between these two vote totals, shown in the map above, can tell us where Clinton and Trump have the most potential to build on 2012.
Then we went a step further: How would the 2016 map look if one out of every five whites without a college degree who voted for Obama in 2012 defected to Trump and if one out of every five non-whites and college-educated whites who voted for Romney in 2012 switched to Clinton? (Why one out of five? It’s a somewhat arbitrary number but represents a realistic shift of these groups, according to polls released over the past few months.) […]
To gauge Clinton’s and Trump’s upside potential, we began by reverse-engineering the 2012 electorate in each state, county and congressional district. To do this, we used population data from the Census Bureau’s 2012 American Community Survey and voter turnout data from its 2012 voting and registration report to estimate the demographic breakdown of the electorate within each geographic area by five groups: college-educated whites, non-college-educated whites, African-Americans, Latinos, and Asians/others.
Then, using using data from 2012 and 2008 exit polls, we estimated Obama’s and Romney’s levels of support from each group within each state. We applied those support levels within each geographic area and adjusted each subgroup’s vote totals proportionally to fit the actual reported votes for each state, county and district. […]
Finally, we used these estimates to calculate, in each state, county and district, the share of college-educated whites and minorities who voted for Romney and the share of non-college-educated whites who voted for Obama. Our “Vote Swap” scenario depicts what would happen if 20 percent of each of those groups switched parties in 2016.
* The 99th is solely within Sangamon County…
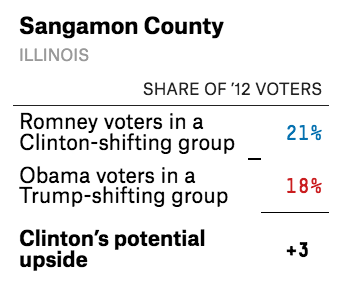
This is imperfect because the county is obviously not wholly within the 99th and the bulk of the county’s African-American population is in a different House district. Also, I just have no idea if 538’s thesis is sound. But it gives you an idea of what the 2016 shift could be and may help explain DelGiorno’s polling numbers.
* Do you see anything else in the map that stands out for you?