*** UPDATED x1 *** Today’s Illinois charts
Wednesday, Jan 25, 2012 - Posted by Rich Miller
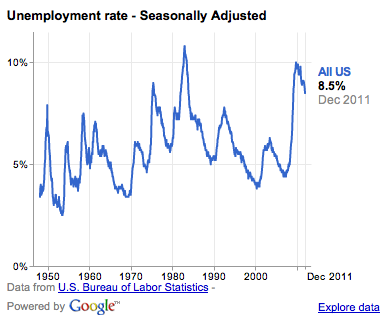
* Google has a great analytical tool that you can use to compare unemployment rates over the years. I’ve done screen caps to make them easier to load. Here is the US rate since 1950, for instance…
* And here’s the Illinois rate since 1990…

That last, big upward unemployment rate spike starts in April of 2011. You can’t see it so well here, but go to the site and check it yourself.
* Now, we overlay Illinois onto the US chart…
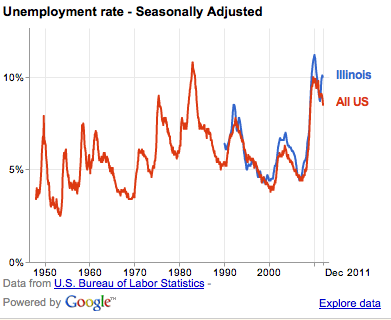
Notice how the Illinois rate spikes in 2011, while the US rate declines.
* So, I started comparing Illinois to other states. Here’s Indiana…
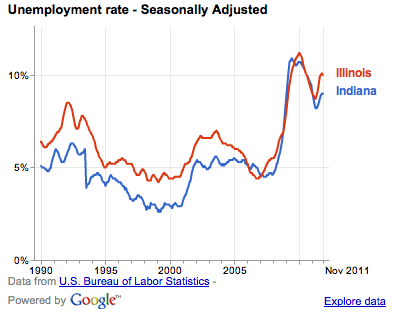
Indiana also has a 2011 upward spike, but it’s smaller than Illinois’ - at least, so far.
* Michigan…
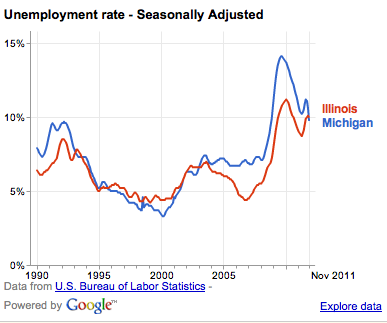
Their rate heads down while ours goes up.
* Ohio…
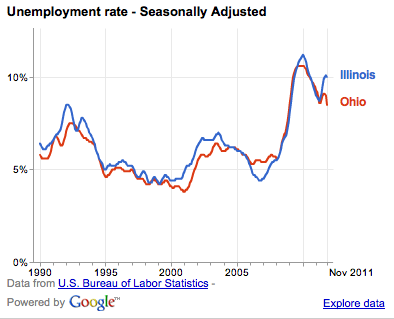
* To make a long story slightly shorter, I went through every state last night and compared them to Illinois. Nowhere did I see the same sort of upward unemployment rate spike in 2011 that we saw in Illinois.
It’s not absolute proof that the January, 2011 income tax hike pushed up the unemployment rate here. The Illinois rate actually went down in December by two tenths of a point, which isn’t showing up on the above charts. And the unemployment rate can mean different things at different times (more people encouraged by the climate and returning to the job market, for instance). But it sure as heck is interesting.
* A commenter linked to this chart yesterday. It’s from the Illinois Department of Public Health and shows Illinois births to unmarried women over the years. Ratios are per 1,000 live births. So, the 2009 ratio of 407.6 is 40.76 percent of all live births…
|
Year
|
Total
Live Births |
Unmarried Women |
| Number |
Ratio |
|
2009
|
171,077
|
69,728
|
407.6
|
|
2008
|
176,634
|
71,836
|
406.7
|
|
2007
|
180,530
|
72,385
|
401.0
|
|
2006
|
180,503
|
69,912
|
387.3
|
|
2005
|
178,872
|
66,266
|
370.5
|
|
2004
|
180,665
|
65,507
|
362.6
|
|
2003
|
182,393
|
64,358
|
352.9
|
|
2002
|
180,555
|
62,860
|
348.1
|
|
2001
|
184,022
|
63,426
|
344.7
|
|
2000
|
185,003
|
63,823
|
345.0
|
|
1999
|
182,027
|
62,045
|
340.9
|
|
1998
|
182,503
|
62,163
|
340.6
|
|
1997
|
180,649
|
60,401
|
334.4
|
|
1996
|
183,079
|
61,706
|
337.0
|
|
1995
|
185,801
|
62,825
|
338.1
|
|
1994
|
189,182
|
64,887
|
343.0
|
|
1993
|
190,709
|
65,086
|
341.3
|
|
1992
|
190,923
|
63,863
|
334.5
|
|
1991
|
194,066
|
63,172
|
325.5
|
|
1990
|
195,499
|
62,052
|
317.4
|
|
1989
|
190,247
|
58,866
|
309.4
|
|
1988
|
184,708
|
54,381
|
294.4
|
|
1987
|
180,441
|
50,611
|
280.5
|
|
1986
|
176,567
|
47,817
|
270.8
|
|
1985
|
180,657
|
46,453
|
257.1
|
|
1984
|
179,216
|
44,796
|
250.0
|
|
1983
|
178,820
|
42,893
|
239.9
|
|
1982
|
183,564
|
42,638
|
232.3
|
|
1981
|
184,897
|
42,352
|
229.1
|
|
1980
|
189,941
|
42,749
|
225.1
|
|
1979
|
184,184
|
40,396
|
219.3
|
|
1978
|
174,397
|
36,161
|
207.3
|
|
1977
|
177,148
|
35,528
|
200.6
|
|
1976
|
170,181
|
33,075
|
194.4
|
|
1975
|
169,248
|
31,503
|
186.1
|
|
1974
|
168,991
|
28,970
|
171.4
|
|
1973
|
168,992
|
29,782
|
176.2
|
|
1972
|
177,848
|
29,971
|
168.5
|
|
1971
|
195,311
|
29,205
|
149.5
|
|
1970
|
205,203
|
27,655
|
134.8
|
|
1969
|
195,699
|
23,862
|
121.9
|
|
1968
|
193,261
|
21,735
|
112.5
|
|
1967
|
195,644
|
20,147
|
103.0
|
|
1966
|
201,284
|
19,140
|
95.1
|
|
1965
|
208,063
|
18,216
|
87.6
|
|
1964
|
222,259
|
16,881
|
76.0
|
|
1963
|
224,787
|
16,015
|
71.2
|
|
1962
|
230,484
|
15,678
|
68.0
|
|
1961
|
237,051
|
15,546
|
65.6
|
|
1960
|
238,760
|
14,385
|
60.2
|
|
1959
|
239,871
|
14,043
|
58.5
|
|
1958
|
234,712
|
12,626
|
53.8
|
|
1957
|
238,579
|
12,055
|
50.5
|
|
1956
|
229,571
|
11,312
|
49.3
|
|
1955
|
220,541
|
10,625
|
48.2
|
|
1954
|
217,229
|
9,809
|
45.2
|
|
1953
|
206,813
|
8,742
|
42.3
|
|
1952
|
205,438
|
7,916
|
38.5
|
|
1951
|
201,082
|
7,425
|
36.9
|
|
1950
|
189,640
|
6,836
|
36.0
|
Discuss.
*** UPDATE *** From the Sun-Times…
Abortions reported in Illinois reached a 37-year low in 2010, a drop that abortion opponents attributed to more women shying away from the procedure while abortion-rights supporters pointed to an uptick in use of contraceptives.
In 2010, there were 41,859 abortions in Illinois, according to recently published data from the state Department of Public Health .
That’s the lowest total since 1973, when Illinois recorded 32,760 abortions. That’s the year the procedure was legalized in the United States in the landmark Roe vs. Wade decision by the U.S. Supreme Court.
 
91 Comments
Sorry, comments for this post are now closed.
|
|


- Newsclown - Wednesday, Jan 25, 12 @ 7:23 am:
Correlation is not causation
http://xkcd.com/552/
- soccermom - Wednesday, Jan 25, 12 @ 7:23 am:
How much of this spike is due to providers who are cutting back or closing? And how much due to public sector layoffs? (These are not rhetorical questions; does anyone have actual data?)
- Shock & Awww(e) - Wednesday, Jan 25, 12 @ 8:00 am:
soccermom: morning! Both questions should be available through BLS data, will try to pull soon as I have a chance. You can also get a decent idea from something called WARN reports (advance notice of pending closures/mass layoffs).
Rich: fascinating stuff, as always. Both pieces of data, while not necessarily representative of the whole picture are fascinating.
One often hears about the increase in children born out of wedlock, but wow!
- Excessively Rabid - Wednesday, Jan 25, 12 @ 8:07 am:
On the unmarried mom stats, one thing to bear in mind is that the aggregate likely family situation for unmarried mothers now is way different that it was earlier in the history presented in the chart. There are now lots of families where you have two parents (of the same or different sexes) who are not married. I still view the whole thing with alarm, but we need to compare apples to apples, and I don’t know if that’s even possible.
- Downstate - Wednesday, Jan 25, 12 @ 8:10 am:
A fascinating piece “Belmont vs. Fishtown” explores these statistical changes and how it alters a community (or a state….or a nation).
http://www.newcriterion.com/articles.cfm/Belmont—Fishtown-7250
- Cornerfield - Wednesday, Jan 25, 12 @ 8:11 am:
Even though it is not surprising, the births to unwed mothers chart is still alarming. The ratio has steadily increased except for 1994 thru 1997. I am curious as to what Illinois was doing then and wondering if maybe we shouldn’t explore doing it again?
This brief downward trend started too soon for it to be The Personal Responsibility and Work Opportunity Reconciliation Act of 1996 (PRWORA).
- Lakeview - Wednesday, Jan 25, 12 @ 8:14 am:
How does the state determine if a mother is not married? If they consider the mother unmarried if she has a different last name than the father, then maybe a lot of married women who kept their maiden names are falling into that category.
- JBilla - Wednesday, Jan 25, 12 @ 8:18 am:
To go with your April 2011 marker, that was the highest gas price ever in Chicago, beating even the high Autumn prices of 2008: http://www.GasBuddy.com/gb_retail_price_chart.aspx?city1=USA Average&city2=Chicago&city3=&crude=n&tme=48&units=us
- cover - Wednesday, Jan 25, 12 @ 8:40 am:
Has anyone compared the ratio of unmarried births to the ratio of births covered by Medicaid?
- Generation X - Wednesday, Jan 25, 12 @ 8:45 am:
-There are now lots of families where you have two parents (of the same or different sexes) who are not married.-
I would imagine that this would represent a tiny portion of the numbers.
- ChicagoR - Wednesday, Jan 25, 12 @ 8:56 am:
Well, allowing same sex marriage would instantaneously drop that number by a bit. Just sayin’…
- Left Out - Wednesday, Jan 25, 12 @ 9:00 am:
You are not the first person to note the increase in births by those who are not married. If you get a bit more detail in the data you will find that most of the increase is for mothers who are not graduates of high school. For those who do not finish high school about 2/3 if the births are to those who are not married. For moms who have more than a college degree only about 5% of the births are to those who are not married (only slightly more than 20 or 30 or 40 years ago). A good guess is that changes in the social class structure in Illinois is one, but only one, of the factors driving the increase in births to the unmarried.
- Anonymous - Wednesday, Jan 25, 12 @ 9:01 am:
Lakeview, the birth certificate includes a question about whether the mom is married, so the information comes from the mom (via the hospital).
- JN - Wednesday, Jan 25, 12 @ 9:02 am:
Interesting that there is a ~10% annual increase prior to ‘73, and then it drops to ~5% after ‘74. Roe v Wade obviously didn’t break the trend, but it clearly wasn’t a cause.
- Lizard People - Wednesday, Jan 25, 12 @ 9:02 am:
If you look at employment (labor force less unemployed), you probably get a more accurate picture, as you won’t get saddled with the unemployment rate disparities caused by the unemployed who start looking (or stop looking) for jobs.
After adding the December BLS data, you get something like this:
http://img41.imageshack.us/img41/6704/employment.jpg
- Jade_rabbit - Wednesday, Jan 25, 12 @ 9:04 am:
This brief downward trend started too soon for it to be The Personal Responsibility and Work Opportunity Reconciliation Act of 1996 (PRWORA).
_______
That time frame was when Norplant came out. I recall a girl that I worked with received the implant in exchange for a cash stipend.
Maybe a successful version of Norplant would show a similar trend to ‘94 - ‘97 numbers.
- Irresponsible - Wednesday, Jan 25, 12 @ 9:08 am:
Writing “it’s not absolute proof” is just rediculous. Why not just conclude by saying, “I’m only speculating, but I’m just saying…” It’s irresponsible journalism to suggest conclusions without sufficient proof, and this is really disgusting. Especially when you start off your charts with 50 and 20 year trends, to suggest that a 6- to 12- month phenomenon will produce a long term trend is just nuts. Also, this chart shows unemployment rate, which takes into account the size of the labor force. Why not examine charts of employment growth, rather than the unemployment rate? Just lazy and ignorant.
- Peggy R/Southern - Wednesday, Jan 25, 12 @ 9:10 am:
Thank you for taking note of the IL DPH chart. We don’t know that all of these unwed births are requiring/eligible for social services from the state, but I imagine a VERY large percentage do receive state benefits. This is why marriages between a man and woman obtain tax benefits–it is meant to encourage marriage before kids are created, minimizing social welfare costs to the state as well as minimizing the social consequences (crime, drugs) often associated single-parent households (usually lower income).
I posted it b/c if we’re going to talk about lowering the cost of state govt, we need to talk about how to change this social problem. As much as some don’t like it, we really need to discourage kids from having sex until marriage. The increase in abortion and birth control services has done nothing to stop this trend. We have to be honest about that.
I think a birth certificate usually indicates whether the parents are married.
–
The unemployment trend is interesting. I don’t know whether it can be tied to that one tax increase. I think there’s a general sense of futility in hoping our legislators and govt would cut the size of the budget after last spring’s session.
- JN - Wednesday, Jan 25, 12 @ 9:20 am:
-families…who are not married, I would imagine that this would represent a tiny portion of the numbers.-
I know of several two-adult households where this is the case.
Also, I just realized that every 5-15 year old child in a single parent household that is known to me personally was born to a married mother. At the same time, every one of those children that was born out of wedlock is now living in a two-adult household.
I would want to see statistics that correlate:
- The age distribution of child-bearing mothers, and
- The age distribution of partners entering their first marriage.
Over this same time period, the age of marriage has changed from leaving primary school, to finishing primary school, to finishing an associates or bachelors, to finishing a masters, clinicals, the bar, etc. The expectation that people remain abstinent until age 30 is practically impossible.
- Anonymous - Wednesday, Jan 25, 12 @ 9:29 am:
Peggy, you’re assuming that the increase in births to unwed mothers is occurring in the lower age groups. Do the data support that?
- JN - Wednesday, Jan 25, 12 @ 9:30 am:
-I posted it b/c if we’re going to talk about lowering the cost of state govt, we need to talk about how to change this social problem.-
Some of those unmarried two-adult households are so because if they got married, the mother and the children would lose their state welfare benefits. And to break yet another impending stereotype, one of those households is headed by a successful business owner.
- Colossus - Wednesday, Jan 25, 12 @ 9:51 am:
Rich, this is just the kind of hyperfocused, Illinois specific information I love to find here. I wish more journalists did their jobs and produced useful information instead of transcribing official speeches and turning them into narratives.
Having lived the better part of a decade among what I call the “seedy underbelly of Illinois” I have watched many of these unwed births happen and God help me, I think I agree with Peggy R on something. But I doubt we will agree on just what that is. A similar analytic tool for birth data would be great to compare other states and see what connections can be made on successful strategies.
I used the unemployment graphs while working on the 2010 campaign and it was invaluable. Note that you can get county level data as well. If Web 2.0 was filling up pages with content and information, then Web 3.0 is making sense of that information. I can’t wait till we have more tools like this to look at all manner of data tracked by the government and allowing interested citizens such as ourselves the tools normally reserved for those in high level budgeting offices.
Yes, there’s doom and gloom and problems everywhere you turn. But it’s a great time to be alive and watch this transformation happen right in front of us. Every once in a while, I have to exclaim “It’s like living in the GD future!” - If you could go back and show your 14 yr old self an iPad, s/he would think you brought it straight from the deck of the Enterprise-D.
- Peggy R/Southern - Wednesday, Jan 25, 12 @ 9:57 am:
Anon,
No, I don’t. I think we have to tell them in HS. We’re teaching sex ed in schools. We can’t teach anything to people after H.S. Births for women under 20 are pretty steady at 10% of all births.
http://www.idph.state.il.us/health/teen/birthsunder20_59-latest.htm
Many of the unwed births could be 2nd or 3rd + children of women who remain unwed. Or women are having their first unwed birth at 20 or 21, rather than 19 or 16. The percent of these babies being born to middle class women, single or living with the fathers, or born into homosexual households (these aren’t adoptions) are pretty small, we have to admit. But I can’t measure. I think it’s safe to assume that the predominant percent of these unwed births are eligible for the social safety net. (Lower income couples living together unmarried may often retain social benefits.) I don’t have stats, but anecdotal observations are clear that these unwed lower income births occur across all races.
- Peggy R/Southern - Wednesday, Jan 25, 12 @ 10:09 am:
JN said “Some of those unmarried two-adult households are so because if they got married, the mother and the children would lose their state welfare benefits.”
And that’s a problem, is it not? We could reduce welfare roles and cut our budget by encouraging marriage. Why should the public provide for a child who has a mother and father to provide for him? Maybe a child shouldn’t get social services if the father is identified–no marriage necessary. Social welfare lets men off the hook.
The general social trend is that a good chunk of people are marrying late or not at all, and imposing upon the public to provide for the children they create outside of marriage. It is a social and fiscal cost to government and society.
Colossus: ;^D
- Nuance - Wednesday, Jan 25, 12 @ 10:12 am:
Thanks, Rich. When I look at the unmarried stats from my birth year of 1953, it makes me understand why I am so out of touch with the reality of today! Now I know at least one thing wrong with me:)
- 3rd Generation Chicago Native - Wednesday, Jan 25, 12 @ 10:29 am:
First off, Wow that was a lot of work Rich (doing the charts) interesting. Michigan and Ohio had unemployement in at least one area higher than Illinois.
Next point is unmarried people and births. In the last couple of years, a lady I worked with had a baby, she is still with the Daddy, but they don’t want to get married. They don’t feel the need.
The next is a guy I work with, he has a daughter, they are still together but they don’t want to get married. Again they don’t feel there is a good reason to get married and complicate things.
Another lady is engaged to the baby Daddy, with no wedding date in site, and they don’t care if there ever is a date for the nuptuals. Indefinate Engagement is fine with them.
I just think it is more socially acceptable not to get married, even when children are involved and with so many divorces (and divorces cost a lot more than weddings, and most people say only the lawyers benefit from a divorce)
- JN - Wednesday, Jan 25, 12 @ 11:03 am:
— We could reduce welfare roles and cut our budget by encouraging marriage —
So to reduce welfare spending on disadvantaged people, we should increase welfare spending on average people? It sounds as though you, as a married taxpayer, are proposing a tax cut for married taxpayers which would increase the state’s deficit at a far greater rate than DCFS.
— Maybe a child shouldn’t get social services if the father is identified-no marriage required —
Punish the child, thereby increasing the likelihood that he lives in poverty, substantially increasing the likelihood that he ends up in jail, which costs a lot more than the original social services. A small tax cut now for a big tax hike later.
There are simple ways to normalize this situation. For example, providing universal health coverage to children in the same way that we provide universal health coverage to senior citizens - and increase taxes accordingly. But thats a nonstarter in this country, because paying $130/mo to the insurance company makes me a bootstrapped patriot, whereas $130/mo to the government makes me a socialist traitor.
- Shock & Awww(e) - Wednesday, Jan 25, 12 @ 11:04 am:
Soccermom @ 7:23: According to BLS data
IL specific
1.) IL overall: 6,049,328 employed in Jan. 2011, 5,976,695 employed in Dec. 2011.
2.) IL gov.: 849,400 employed in Jan. 2011, 843,000 employed in Dec. 2011.
National gov. jobs data:
1.) Total U.S. state gov. jobs were 5,136,000 in Jan. and 5,077,000 in Dec.
2.) Total U.S. local gov. jobs were 14,240,000 in Jan. and 14,078,000 in Dec.
Gauging how much of this spike comes from service provider closures is more difficult. The only ways I’ve ever been able to track that is by following:
1.) IL “Education and Health Services” (though the Education #’s throw things off when looking for health/service provider info). This sector actually added jobs, going from 842,7000 in Jan. 2011 to 860,600 in Dec. 2011.
2.) IL “mass layoff events, all industries” dropped to 676 in 2011 from 804 in 2010.
3.) The news & occasional surveys of service providers. There have been multiple recent reports of service providers being forced to close. Surprisingly, these closures often stem from gov. (state & fed.) funding drying up rather than private donations drying up.
Two examples?
- In Dec. a Springfield program serving 70 low income teenage parents was closed after waiting over 6 months to receive their funds from the state.
The worst part??? Federal money to fund the program arrived on time. It sat in the state’s coffers, waiting for distribution.
The state, however, refused to pay out the federal money until they had “a certain level” of matching state funds to distribute as well. VERY, VERY, VERY frustrating.
- The Hull House closure, just announced this week, is another more recent example.
- Bitterman - Wednesday, Jan 25, 12 @ 11:07 am:
Thanks for providing the link to this data, good stuff. Indeed, why has Illinois unemployement spiked while our neighbors continued to drop? Could there be a corelation with government policies? Wisconsin, Ohio, Michigan, Indiana, Missouri elected governors and/or legislatures who have pushed through broad pro-business policies while here we’ve raised taxes and picked around the edges of WC and UI reform. Oh and provided “targeted” breaks for certain companies. But… that probably is not the reason for the difference.
- WashingtonIrving - Wednesday, Jan 25, 12 @ 11:12 am:
You know you are hitting a low point when the best thing about your state is that it is better than Michigan. Potential for upcoming campaign slogan. We beat out Michigan in unemployment!!
- soccermom - Wednesday, Jan 25, 12 @ 11:13 am:
Births to unmarried women are up, and abortions are at a record low.
http://www.suntimes.com/10133984-417/illinois-abortions-at-record-low.html
If you put these two sets of statistics together — and assume, for the sake of argument, that all births to unmarried mothers are unplanned, which is clearly not entirely true — then, in 1978, Illinois recorded 106,372 unplanned pregnancies (70,211 of which were terminated.) In 2009, Illinois recorded 115,805 unplanned pregnancies (46,077 of which were terminated.)
In 1980, our state population was roughly 11.4 million, according to census data. In 2010, it was roughly 12.8 million. So the population has increased by something like 15 percent (I am doing this in my head) and the number of unplanned pregnancies is up by something like 8.5 percent.
Seems like the story here is that a larger number of young women are choosing to parent, not that our young folks are going to heck in a handbasket.
- RMWStanford - Wednesday, Jan 25, 12 @ 11:15 am:
It is certainly interesting that Illinois was the only state to have a upward spike in 2011 and some what worrying. If the total numbers of jobs in Illinois declined over the period that would indicate the unemployment rate did not rise just because more people re-entered the labor force. Illinois has a had a problem with job creation for long time. If we can find what the factors are that hold back job growth here that will go a long way to fix a lot of the state’s fiscal problems too.
- jeff - Wednesday, Jan 25, 12 @ 11:21 am:
I look at the total number of live births and wonder who is going to be working to fund Social Security for me? I was born in 1958, 230k+ births. If I retire in 12 years, the replacement birth rate is 190K. How can that work? Immigration?
I am writing from a selfish point of view but there are serious policy questions in it.
Does the lower birth rate over the last 2 decades have more to do with lower crime rates than actual policing? Just wondering.
- Jade_rabbit - Wednesday, Jan 25, 12 @ 11:23 am:
@ RMWStanford.
Do you think Unions and Prevailing wages are a factor?
I think the State has plenty of work for farmers and White Collar, but lacks industrial manufacturing. I think that the ILEPA has created very expensive policies for physical work. The last policy on soil testing for spoils was a blanket cost for all projects at the wrong point in the process. The EPA should have the site tested prior to construction, not as the trucks are heading to the landfill.
- Jade_rabbit - Wednesday, Jan 25, 12 @ 11:25 am:
Jeff,
I think that the Millenia Generation is pretty large and should be able to cover the baby boomers. The issue will be filling jobs that require experience with Generation X.
- soccermom - Wednesday, Jan 25, 12 @ 11:26 am:
S&A — here’s the stat that caught my eye:
IL overall: 6,049,328 employed in Jan. 2011, 5,976,695 employed in Dec. 2011.
So we added roughly 72,000 jobs from December to January? Not amazing, but not bad — and suggests that the tax hike is not driving our economy into the dirt.
And let’s remember that, historically, the unemployment rate ticks up a bit when the economy recovers. We call that the Bob effect — as in, when Bob gets a job after long-term unemployment, his unemployed and discouraged friends look at each other and say, “Jeepers, if they’d hire somebody like Bob, they’d hire me.” So they start looking for jobs again, which makes them unemployed jobseekers instead of discouraged former workers.
- Peter Snarker - Wednesday, Jan 25, 12 @ 11:28 am:
While the “birth” chart is focused on the unmarried aspect, I would also note that Illinois births in 2009 were the 5th lowest of any year in the last 60 years. Only the period of 1973 - 76 was lower. When correcting for population growth since the 1970s, I’d hazard a guess that it was, percentage wise, the LEAST “confident” year on record.
Having a (planned) child is perhaps the ultimate “optimistic’ act, if you think about it. It’s a committment to the future in a cosmic sense, your own future, your child’s future, economic, educational, and a million other ways that parents understand. It’s a committment that has few parallels - you are a parent for life.
My point is that if having a planned child is essentially a vote of confidence in the future, yours as a family and as a society (can I afford this? will I lose my job? what is my neighborhood like? etc) then pretty clearly Illinois citizens had their 5th “least confident” year since 1950. Especially when you consider that the 1970s population of Illinois was about 1 or 2 million less than current counted population.
- mark walker - Wednesday, Jan 25, 12 @ 11:29 am:
Thanks for the unemployment data and charts. They’re a great way to start discussion, and to encourage us to do further research and use our own resources for analysis. This is a political discussion blog site, not an economic report — and it’s done well.
- Shock & Awww(e) - Wednesday, Jan 25, 12 @ 11:35 am:
@ soccermom: I’m sorry if I wasn’t clear in posting those #’s or crammed too much data in.
We LOST -72,633 jobs between Jan. 2011 and Dec. 2011.
Jan. 2011: 6,049,328 employed
Dec. 2011: 5,976,695 employed
- soccermom - Wednesday, Jan 25, 12 @ 11:38 am:
S&A — If the number is bigger in January, isn’t that a gain?
- Peter Snarker - Wednesday, Jan 25, 12 @ 11:45 am:
Soccermom - No, it’s a loss. If you have less at the end of the year than the beginning of the year…
- soccermom - Wednesday, Jan 25, 12 @ 11:47 am:
sorry — i forgot what year it was. You’re right - duh. I was looking at Jan 11 and thinking Jan 12. I’m scarlet.
- Robert - Wednesday, Jan 25, 12 @ 11:47 am:
soccermom, I believe you are misreading Jan 2011 as Jan 2012.
- Jade_rabbit - Wednesday, Jan 25, 12 @ 11:47 am:
@Peter Snarker:
What about the ticking of the biological clock?
It would be interesting if this chart came with an average age of mother for the year. I imagine that if the average age is above 25/26 it might be more likely that the birth is planned.
- soccermom - Wednesday, Jan 25, 12 @ 11:53 am:
Thanks, Robert — I am very distracted today.
- Yellow Dog Democrat - Wednesday, Jan 25, 12 @ 12:07 pm:
@Shock, soccermom, mark walker, et al:
Since Jay Rowell and Steve Schnorf aren’t here today…atleast not yet…I’ll do my best to fill in the gaps.
First, as I’ve said before, when it comes to job creation/losses, the Midwest lags behind the East Coast and West Coast just as we do in fashion, music, drug use preferences, and pop culture.
Recessions start in California and New York and economic recovery starts in California and New York.
Within the Midwest, Illinois is the last to see statistically significant changes because we have the most diverse economy…a drop in agricultural exports sends shockwaves through Iowa, manufacturing losses ripple through Missouri, but our diverse economy has built in shock absorbers.
However, Illinois can experience a double-dip in unemployment rates when the actual number of people re-entering the job market — which is driven largely by perceived trends in how the NATIONAL economy is doing — outpaces the actual number of jobs created here, which generally lags behind the rest of the nation.
In our unemployment rates, we are victims of our own optimism. Another way you can look at it is the unemployed in Wisconsin and Indiana are much slower to get off their butts and go look for work.
The press and policymakers focus too often on unemployment rates, and to me, from a policy-making perspective, the most single important number is the total number of private sector jobs. We only have indirect impact on unemployment rates because we can’t influence how many people are looking for work. And I focus on private sector jobs because there’s widespread agreement that private sector jobs are good (Republicans argue that hiring teachers and police is bad, but that’s another discussion).
Shock’s job’s #’s above include government employees, so here it is: Illinois’ non-seasonally adjusted private sector jobs totals:
January, 2010: 4,618,200
January, 2011: 4,685,800
December, 2011: 4,863,600
In other words, Illinois added 178,000 private sector jobs in 2011.
To be sure, that was offset by job losses in government.
And although I don’t have comparable data for the non-profit sector, I can tell you this.
As of 2010, the non-profit sector was the third-largest employer in Illinois, behind the service industry and manufacturing.
1 in 10 people worked for a non-profit.
And while for-profit employment shrank by 1.1 percent from 2000 to 2010, non-profit employment actually grew by .9%, helping to offset those job losses.
So yes, there important economic reasons, not just social and moral reasons, to be concerned about the strength of Illinois’ non-profit sector.
Having said all that, as I’ve said before, governors and lawmakers who take credit for job creation are fools. The President, federal government, and Federal Reserve BARELY have the power to move the economy. We mostly create the right conditions for seeds to fertilize if they should happen to blow our way. And governors and lawmakers should focus on how they are tilling, fertilizing and watering the ground:
- Ensuring a good public education system and well-trained workforce;
-Providing a strong and reliable infrastructure for transportation, communications, and energy;
-Creating the kinds of communities that CEO’s and high wage workers want to raise their families in: quality cultural institutions, good parks and recreation, safe streets
If you look beyond the talking points regurgitated by GOP/business shills, these are the kinds of things that experts agree local government needs to do to ensure an economy that is Built to Last.
- Yellow Dog Democrat - Wednesday, Jan 25, 12 @ 12:12 pm:
To Repeat: Illinois ADDED 178,000 private sector jobs in 2011.
- wordslinger - Wednesday, Jan 25, 12 @ 12:15 pm:
I’ve looked at this a few times now over a few hours, and I can’t figure out for the life of me what people are talking about.
Unemployment rate. Tax increase. Births out of wedlock. Is there some connection I’m supposed to be making here?
For the record, the state corporate income tax is a cost of doing business, for the less than half of businesses that pay it, but it’s not a deal-breaker by any stretch. Are we supposed to believe that a tax that not many businesses pay is keeping them from hiring? I’m lost.
Secondly, births out of wedlock are on the spike among those of us of European stock, here in the United States and in Europe.
I blame Madigan. And Quinn. Maybe Berlusconi, too. There has to be some connection, right?
http://www.foxnews.com/story/0,2933,520052,00.html
- Shock & Awww(e) - Wednesday, Jan 25, 12 @ 12:15 pm:
YDD - Hi! It’s my understanding that the seasonally-adjusted figure is the commonly accepted standard for job creation. Nearly everyone I’ve ever read or known (including Gov. Quinn during his last campaign, the current White House and the Dept. of Labor’s Bureau of Labor Statistics) uses that figure as the benchmark for job creation, since non-seasonally adjusted #’s can fluctuate so much.
Regardless, what’s the BLS series ID # on that data regarding non seasonally-adjusted jobs? I don’t see it and would sincerely like to explore / educate myself further.
- soccermom - Wednesday, Jan 25, 12 @ 12:18 pm:
Word — I don’t understand your confusion. Unemployment, tax increases and out-of-wedlock births are ALL BAD THINGS. So they must be connected, in their badness.
- Shock & Awww(e) - Wednesday, Jan 25, 12 @ 12:22 pm:
For anyone who’d like to explore further, here’s the link to the BLS labor force, employment & unemployment data for Illinois: http://bit.ly/wfbwwp
- Left Out - Wednesday, Jan 25, 12 @ 12:27 pm:
I just took a look at the Illinois unemployment rate from 1950 to 2009 from the BLS. I matched it with the percent of unwed mothers in the state year by year over the same time period. I found that the correlation coefficent was .29 (or almost no relationship). Plotting the two data series it it evident that since about 1960 (plus or minus a year or so) the percent of unwed mothers has gone up almost every year. In years of high unemployment there are more unwed mothers and in years of low unemployment there are more unwed mothers. For example, the unemployment rate was low at about 4% in 1956, 1967, and 2000, but the percent of children born to unwed mothers these years was 5%, 10% and 34%. The economic cycle, as measured by the unemployment rate, appears not to be a defining factor in the increase the continusing increase number of children born to unwed mothers.
- Peggy R/Southern - Wednesday, Jan 25, 12 @ 12:30 pm:
JN
1. I have not advocated any increased welfare spending on “average” or any other group of citizens. I don’t know what you mean.
2. I didn’t suggest a tax decrease, from current levels, for married couples. Parents, married or single I think, get deductions per child already. Some argument is that marrieds pay a higher rate than singles due to combined higher income bracket.
3. Don’ punish the child. Make the father support him. Don’t allow fathers to abandon children they helped create.
4. Do you really think children on public assistance are not in poverty already? Not usually involved in crime or drugs? Do you think they are already doing well and would do worse to have their fathers pony up some support and perhaps some involvement?
5. Universal medical insurance is irrelevant. Children and pregnant women on public aid get medical coverage. A key point I wish to make is that the availability of public assistance does not discourage unwed sex and childbearing, in fact it makes people less responsible, knowing that public aid is out there. Young men can walk away in particular. And the welfare state expands.
- reformer - Wednesday, Jan 25, 12 @ 12:32 pm:
Since the year I was born, the percentage of babies born to single moms has grown by a factor of over eleven. It is more than 11 times higher than it was when I was born.
- Marty - Wednesday, Jan 25, 12 @ 12:34 pm:
Unemployment rate is VERY misleading and monthly figures doubly so. Seasonal adjustments are all out of whack because of the recession, and with people in and out of teh labor force plus normal survey variance, it’s a fools’ game.
If you want to get a better picture, focus on total or non-farm private sector employment, hours worked and average compensation (the private sector jobs pay for the public sector so it’s private sector jobs that are most important in the long run. And look at a 3-month moving average.
As for unwed births, well, there have certainly been some cultural changes, but hey, evetything else being equal you get more of what you subsidize and less of what you penalize. We try to support people in distress even if it’s their own doing, and we’re nice to do that, but in the end you can never solve the problem that way because as you help some you encourage others to act irresponsibly, so you just chase your tail while hiking taxes and hurting the economy that has to pay fro it all. No easy answers.
- Shock & Awww(e) - Wednesday, Jan 25, 12 @ 12:36 pm:
Bizarre. Seasonally-adjusted nonfarm payroll is the standard benchmark for job creation.
The “employment” chart the BLS links to (posted above) is “seasonally-adjusted”, but the #’s differ from the “seasonally adjusted non-farm payroll” #’s. Very strange.
Regardless, the “seasonally-adjusted non-farm payroll for IL - the bencjmark that is commonly used to measure job creation - is located here: http://bit.ly/z8m16b
It shows
Jan. 2011: 5,648,000
Dec. 2011: 5,676,400
For a net gain of 28,400 jobs.
Bizarre the BLS would use “seasonally-adjusted” but not “seasonally-adjusted non-farm” #’s on that first chart. Anyways, I hope this help clarify and provide solid info to the team.
- Pot calling kettle - Wednesday, Jan 25, 12 @ 12:36 pm:
==Does the lower birth rate over the last 2 decades have more to do with lower crime rates than actual policing? Just wondering.==
==Having a (planned) child is perhaps the ultimate “optimistic’ act, if you think about it. It’s a committment to the future in a cosmic sense, your own future, your child’s future, economic, educational, and a million other ways that parents understand.==
True, however…
Fertility rates tend to decline as the socioeconomic status of and opportunities for(education and workplace) women improve. These impacts are reflected in the overall decline in births since the 1950’s. When the overall declining numbers are divided by the rising population, the impact is even more dramatic. On top of that, there appears to be a general trend that probably reflects the economic situation (among other factors).
- wordslinger - Wednesday, Jan 25, 12 @ 12:41 pm:
Soccermom, the Cubs haven’t won the World Series since the fall of the Czar. I blame Lenin.
And the Wrigleys. And the Tribbies. And Alex Gonzalez, who booted an easy, inning-ending double-play ball in Game Six against the Marlins.
There are no other explanations as to how the Cubs failed to win the pennant up three games to one with Zambrano, Prior and Wood set to pitch. None.
Except Madigan. He controls everything in Illinois and is a well-known Sox fan. Coincidence? Please.
- wordslinger - Wednesday, Jan 25, 12 @ 12:53 pm:
–A key point I wish to make is that the availability of public assistance does not discourage unwed sex and childbearing, in fact it makes people less responsible, knowing that public aid is out there–
You’re right, Peggy. There’s no greater aphrodisiac than the anticipation of filing for welfare. Without public aid, who would even want to have sex?
- Wensicia - Wednesday, Jan 25, 12 @ 12:57 pm:
Part of the problem in the rise of unwed births is many families in certain social-economic situations are in their third or fourth generation of the single mother/grandmother as head of the family. They’re not just having babies at an early age, they continue this pattern throughout their childbearing years. It’s a family structure enabled by government support systems.
- steve schnorf - Wednesday, Jan 25, 12 @ 1:06 pm:
ws, lmao
- Rich Miller - Wednesday, Jan 25, 12 @ 1:12 pm:
===Writing “it’s not absolute proof” is just rediculous. Why not just conclude by saying, “I’m only speculating, but I’m just saying…” It’s irresponsible journalism to suggest conclusions without sufficient proof, and this is really disgusting. ===
First of all, bite me.
Secondly, I’d never seen anyone else graphically compare Illinois’ 2011 unemployment rate trendlines before, so I thought I’d look. I also clearly pointed out why this may not be causation. However, when Illinois is the only state to see a spike like that, it’s certainly appropriate to discuss why.
As to your other comments, bite me, again.
Have a nice day.
- wordslinger - Wednesday, Jan 25, 12 @ 1:15 pm:
Two “bite me” and “have a nice day?” That poster has to get some kind of Golden Horseshoe, I think.
- Rich Miller - Wednesday, Jan 25, 12 @ 1:22 pm:
Word, those awards are reserved for positive achievements. lol
- Soccermom - Wednesday, Jan 25, 12 @ 1:29 pm:
Rich, are you going for the Wordslinger Commenter of the Year Award? Because I think you are disqualified ex officio
- Lakeview - Wednesday, Jan 25, 12 @ 1:32 pm:
Thanks for answering my question about the source of information about mother’s marital status.
I’d be really curious to see data about adoption against the abortion numbers, too. Anecdotally, I’ve heard that the shortage of babies for domestic adoptions is that so many women keep their babies now given that the stigma of unwed motherhood has declined.
- Jade_rabbit - Wednesday, Jan 25, 12 @ 1:35 pm:
Are the kiddies from the poli-sci class taking notes?
- Grandson of Man - Wednesday, Jan 25, 12 @ 2:01 pm:
==Wisconsin, Ohio, Michigan, Indiana, Missouri elected governors and/or legislatures who have pushed through broad pro-business policies while here we’ve raised taxes and picked around the edges of WC and UI reform.==
The “pro-business policies” in Wisconsin are not working. Wisconsin lost jobs for multiple months, including, at first estimate, in December 2011.
- Abu Iskandr - Wednesday, Jan 25, 12 @ 2:56 pm:
==- Colossus - Wednesday, Jan 25, 12 @ 9:51 am:
Yes, there’s doom and gloom and problems everywhere you turn. But it’s a great time to be alive and watch this transformation happen right in front of us. Every once in a while, I have to exclaim “It’s like living in the GD future!” - If you could go back and show your 14 yr old self an iPad, s/he would think you brought it straight from the deck of the Enterprise-D.==
“Any technology, sufficiently advanced,is indistinguishable from magic.”
–Arthur C. Clarke
- Abu Iskandr - Wednesday, Jan 25, 12 @ 3:00 pm:
==- WashingtonIrving - Wednesday, Jan 25, 12 @ 11:12 am:
You know you are hitting a low point when the best thing about your state is that it is better than Michigan. Potential for upcoming campaign slogan. We beat out Michigan in unemployment!!==
Pure Michigan: We’re the Mississippi of the Great Lakes
- Both Sides Now - Wednesday, Jan 25, 12 @ 3:29 pm:
@Wordslinger - I would agree that “the anticipation of filing for welfare” is not an “aphrodisiac”, but I don’t think it holds the stigma it once did. Between Jerry Springer, Maury, and the other daytime dramas, those watching are led to believe that having unprotected sex with multiple partners resulting in pregnancies and then coming on a national stage to discover who the father is and shout expletives at him is “normal”. And like it or not, it’s pretty apparent that those that do go on stage are probably being supported by the public.
- wordslinger - Wednesday, Jan 25, 12 @ 3:40 pm:
BSN, I don’t put as much faith as you do in Springer and Maury when it comes to facts supporting public policy.
For the record, teen pregnancy rates in the U.S. have been on the decline for about 20 years, and Illinois’ rate is one of the lowest in the country.
I blame Madigan.
http://www.cdc.gov/nchs/data/databriefs/db46.pdf
- jerry 101 - Wednesday, Jan 25, 12 @ 4:21 pm:
Darn it. I lost a big post breaking down the stats from this report: http://www.bls.gov/sae/eetables/tabled1.pdf
Executive summary instead of big report:
I took the total seasonally adjusted, nonfarm employment for each of the 50 states plus DC, and the table that shows government employment for each state. Using those two tables, and the columns for November 2010 and November 2011, I came up with Total Seasonally Adjusted, Nonfarm, Nongovernment Employment for each of the 50 states (plus DC). I then calculated the total change in employment year over year, and the percentage change.
Findings: Illinois was #9 in total jobs added (66.6). Ohio & Michigan were higher at 5 and 7 respectively. Indiana was 40th nationally in jobs added. Texas, California, and Florida added the most jobs. Delaware was the only state to lose jobs in that time.
In terms of percentage increases, Illinois was 25th in the country at +1.39%. Michigan and Ohio were higher at 12 & 15. Indiana was 48th.
Tops overall were energy industry states - North Dakota, Texas, and Oklahoma.
Oddly, Alaska fared poorly, only gaining .25% jobs (tied, in percentage terms, with the Hoosiers).
Wisconsin, Missouri, and Iowa all fared worse than Illinois in both measures.
As a bonus, I also calculated the percentage of total jobs in each state that are government jobs.
Top 5 are DC (34%), Wyoming, Alaska, New Mexico, and Mississippi (22%). Bottom 5 are Illinois (14.82%), Massachusetts, Rhode Island, Nevada, and Pennsylvania.
Oh, and despite losing 10 million government jobs in that one year, Illinois actually fares slightly better when you don’t back out government jobs. #8 nationally in total jobs added (just behind michigan) thanks to Pennsylvania shedding 20 million government jobs.
We also move up one spot in percentage terms when you don’t back out government jobs. +1.01% year over year.
- jerry 101 - Wednesday, Jan 25, 12 @ 4:25 pm:
oh, and those jobs figures should state somewhere “thousands of jobs”.
- wordslinger - Wednesday, Jan 25, 12 @ 4:27 pm:
–Oh, and despite losing 10 million government jobs in that one year, Illinois actually fares slightly better when you don’t back out government jobs. #8 nationally in total jobs added (just behind michigan) thanks to Pennsylvania shedding 20 million government jobs.–
?
- mark walker - Wednesday, Jan 25, 12 @ 4:38 pm:
Throwing new charts, and an unrelated table, at this crew is like raw meat to wolves.
- Lizard People - Wednesday, Jan 25, 12 @ 4:50 pm:
It still boggles my mind that anyone really cares about payroll data (which is the data that jerry 101 is pointing out). The data doesn’t really measure what people think it does, so they draw a lot of wrong conclusions.
If a company needs 40 work hours per week, an hires one full-time person, that adds one job to the payroll data. If they hire 4 people at 10 hours a week, that adds 4 jobs to the payroll data. Is the latter really 4 times the economic growth?
Also, if a company cuts your hours at one job and you get another, you’re counted twice. Is that really more economic growth?
When you look at the employment data (not the payroll data), you can see that regardless of the number of “jobs” we added, the number of people who HAVE jobs (labor force less unemployed) dropped substantially.
It started to rise again in September, but has thus far been only half as fast as the 2010 growth and we’re still well below pre-tax hike levels.
So how can this be? The people getting these “new jobs” which you folks are calling some kind of economic miracle aren’t the unemployed: they’re people looking for a second or third job, maybe because their hours at one job were cut, maybe because they just need the extra money, maybe because it’s easier for them to find a second job than their unemployed spouse to find a first one.
- Jerry101 - Wednesday, Jan 25, 12 @ 5:16 pm:
Wordslinger…that should have said thousand. 20 million jobs lost would devastate any state.
LP - true, it’s all an imperfect measure. Until the gov figures out how together companies to report full-time equivalent data, but for discussions like this, that would still be poor data. After all, 2 20-hr a week jobs is almost always
- DuPage Dave - Wednesday, Jan 25, 12 @ 7:43 pm:
This is a trend all over the U.S. and pretty much all over the world. It has nothing to do with any policies in Illinois. People don’t seem to feel the need to get married these days.
This chart has the international data. It puts the U.S. average for 2007 at 40 percent, or the same rate as in the Illinois chart.
http://www.cdc.gov/nchs/data/databriefs/db18_Fig_6.png
- DuPage Dave - Wednesday, Jan 25, 12 @ 7:47 pm:
Also- here’s how Illinois compares to other states in births to unmarried mothers- we are sort of in the middle of the pack with Utah at 20 percent and Mississippi at 55 percent.
http://datacenter.kidscount.org/data/acrossstates/Rankings.aspx?ind=7
- Ken - Wednesday, Jan 25, 12 @ 8:52 pm:
I’ve long wondered if there is some way we could provide the needed social safety net without subsidizing illegitimacy. For instance, could a state say that children are only counted toward a family’s LinkCard amount if the child is legitmate? Would that be Constitutional? Anyone else have ideas to provide the needed social safety net without subsidizing illegitimacy?
- Ken - Wednesday, Jan 25, 12 @ 8:54 pm:
Perhaps one would need to grandfather in children born or conceived before the bill passes to remove the subsidy referenced in the previous comment, at least for political consumption if not Constitutionality.
- wordslinger - Wednesday, Jan 25, 12 @ 9:35 pm:
Ken, you really don’t want to take food from poor kids, do you? What did they do wrong?
- steve schnorf - Wednesday, Jan 25, 12 @ 11:12 pm:
ken, I’ve also been puzzling about some way to starve illegitimate children, but I have decided we just couldn’t get away with it. Not everyone sees the world’s problems as clearly as you and I do.
- WashingtonIrving - Thursday, Jan 26, 12 @ 10:16 am:
For what it’s worth:
http://illinoispolicy.org/news/article.asp?ArticleSource=4639
- Yellow Dog Democrat - Thursday, Jan 26, 12 @ 10:33 am:
@Shock, Jerry -
I just use the BLS’ custom table builder to get the data that I want.
And unless someone can explain to me and the average voter what “adjustments” are made to reach “seasonal adjustments”, I’ll continue to use the raw, unadjusted data, thank you very much.
If I want to account for any “seasonal adjustments” I can do it myself by comparing the raw employment numbers from Dec, 2011 to Dec, 2010 (instead of Jan ‘11), which would account for spikes in say, retail employment.
But raw data is transparent.
As for the whole farm v. private v. public employment argument:
Why would you NOT count farm jobs in a state where Agriculture is the third largest sector of your economy?
Why would you include Government jobs when no one is arguing that our goal should be to grow the Public sector?
@Ken, Schnorf -
I believe Newt Gingrich tried that in ‘95 when he wanted to eliminate the school lunch subsidies…um, didn’t play too well.
BTW, instead of blaming the mother or the children, perhaps we should be asking why so many dads like Congressman Walsh aren’t paying their child support?
And on another policy point, word came out yesterday that abortion rates are at historic lows.
I’m guessing you’d also find that atleast until the collapse of ‘08, adoption rates are at historic highs.
Let’s not read too much into ONE data point, even if it has been tracked over 20 years.
And try to remember what you learned in 8th grade science class: correlation is not causation.
Except when it comes to drinking milk, which has been strongly correlated with heroin abuse later in life.
Turns out that almost ALL heroin addicts drank milk as kids.
- mark walker - Thursday, Jan 26, 12 @ 10:47 am:
All children are legitimate. Not all parents support their children.
- Lizard People - Thursday, Jan 26, 12 @ 12:37 pm:
==LP - true, it’s all an imperfect measure. Until the gov figures out how together companies to report full-time equivalent data, but for discussions like this, that would still be poor data. After all, 2 20-hr a week jobs is almost always==
You didn’t finish this thought, but what I was getting at was the using payroll data at all in a discussion about PEOPLE (what Rich was getting at with unemployment figures) is silly.
Payroll data (”jobs” data broken down by industry) doesn’t count people. Household data (where the employment and unemployment rates come from) does. Jumps in payroll numbers are only important if there are associated jumps in employment numbers.
And when you look at the employment figures, we’re doing terribly. The fact that a number of people had to get second and third jobs in order to make ends meet (the only way to explain the simultaneous increase in the number of jobs and the decrease in the number of people employed) is not a marker of economic growth.
Change in number of employed residents during 2011 (seasonally adjusted) 1/2011 to 12/2011:
Illinois: 72,628 fewer employed residents
Indiana: 6,473 more employed residents
Iowa: 10,978 fewer employed residents
Missouri: 103,028 more employed residents
Wisconsin: 19,099 more employed residents
Change in number of employed residents during 2011 (not seasonally adjusted) 12/2010 to 12/2011:
Illinois: 78,400 fewer employed residents
Indiana: 74,700 more employed residents
Iowa: 7,200 fewer employed residents
Missouri: 114,200 more employed residents
Wisconsin: 21,600 more employed residents
- Jade_rabbit - Thursday, Jan 26, 12 @ 12:54 pm:
@Mark Walker,
So how do you get the mother to disclose the father at time of birth? Can the state recover the cost of benefits if the mother decides not to pursue child support? If the father has a good paying job, supports the family, but is not married or leaglly tied to the children why would the parents give up the supplemental income?
- Sori - Thursday, Feb 9, 12 @ 1:41 am:
I rlaley enjoy Ringer and all its crazy twists. A guilty pleasure. I don’t see how they’ll sustain it, though. And it rlaley shows what a limited actress Sarah Michelle Gellar is – she makes no differentiation between the two characters she plays.
- lxkdpeq - Thursday, Feb 9, 12 @ 7:05 am:
Ff4B6s bypyqeuyueeu