* From the Human Rights Campaign…
To: Interested Parties
From: John Hagner, Clarity Campaign Labs
Date: August 14, 2015
Subject: IL-10 Voters Show Strong Support for Federal LGBT Non-Discrimination Protections
A new poll conducted by Clarity Campaign Labs on behalf of the Human Rights Campaign shows strong support for a new federal LGBT non-discrimination bill (The Equality Act) in the district of Congressman Bob Dold. The same survey shows Dold starts with a narrow lead over former Congressman Brad Schneider and is well under 50%.
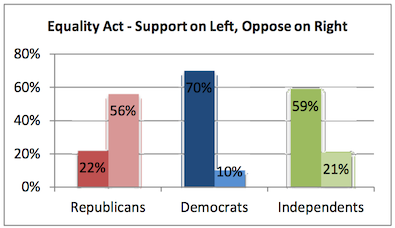
Support for the new Equality Act was widespread. Voters in IL-10 support it by a 21 point margin, with 49% saying Congress should pass it and 28% saying they should not. Democrats support it by wide margins – 70% to 10%, but equally important is the strong support from Independents: 59% to 21%. There is substantial Republican support as well, with 22% of Republicans saying Congress should pass the bill.
We described the law neutrally, reading voters this summary: “The Equality Act is a bill that would extend existing non-discrimination laws to protect gay, lesbian, bisexual, and transgender people in housing, services and public spaces, credit, and employment.”
Voters who are undecided on this new non-discrimination bill appear highly persuadable. 71 percent of those undecided on the Equality Act are either Democratic or Independent voters. Importantly, Congressman Dold’s willingness to oppose the Equality Act could have significant implications for his re-election.
If he opposes the Equality Act, 18% of his current supporters say they would be less likely to vote for him next November, and 29% of people who are currently undecided say they’d be less likely to support him. Only 18% of undecided voters say they’d be more likely to support him.
We find that in the race for Congress in 2016, the incumbent Republican Dold starts out with a narrow lead, within the poll’s margin of error. Including leaners, 44% of voters are supporting Dold, with 40% supporting former Congressman Brad Schneider.
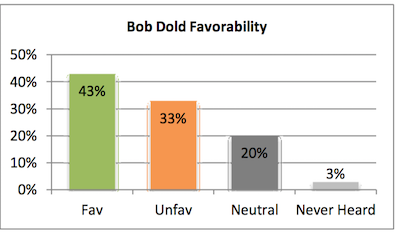
The voters of the district have divided opinions on Dold, with 43% having a favorable view and 33% an unfavorable one.
Methodology: A poll of registered voters in Illinois’s Tenth Congressional District. We surveyed 530 voters with an IVR survey and we matched the sample to the voter file and weighted it to reflect the electorate in this district. The margin of error is +/- 5.16% at a 95% confidence interval.
So, in other words, supporting the bill might erode some of Dold’s conservative GOP support. Then again, where else are they gonna go unless a strong third party candidate emerges?
* Some charts…
* Meanwhile, there’s been a bit of chatter recently from gay rights groups about ginning up a Democratic primary against Congressman Lipinski. So…
To: Interested Parties
From: John Hagner, Clarity Campaign Labs
Date: August 14, 2015
Subject: IL-3 Voters Show Strong Support for Federal LGBT Non-Discrimination Protections
A new poll conducted by Clarity Campaign Labs on behalf of the Human Rights Campaign shows strong support for a new federal LGBT non-discrimination bill (The Equality Act) in the district of Congressman Dan Lipinski. The same survey shows Lipinski leading in his re-election campaign, but that more than a third of his supporters would be less likely to support him if he didn’t support the Act.
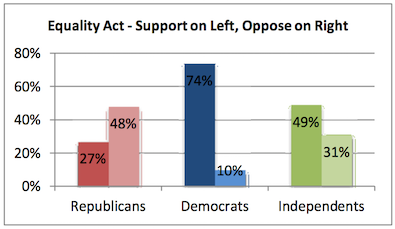
Support for the new Equality Act was widespread. Voters in IL-3 support it by a 28-point margin, with 56% saying Congress should pass it and 28% saying they should not. Democrats support it by wide margins – 74% to 10%, but equally important is the strong support from Independents: 49% to 31%. There is substantial Republican support as well, with 27% of Republicans say Congress should pass the bill.
We described the law neutrally, reading voters this summary: “The Equality Act is a bill that would extend existing non-discrimination laws to protect gay, lesbian, bisexual, and transgender people in housing, services and public spaces, credit, and employment.”
Voters who are undecided on this new non-discrimination bill appear highly persuadable. 70 percent of those undecided on the Equality Act are either Democratic or Independent voters. Importantly, Congressman Lipinski’s willingness to oppose the Equality Act could have implications for his re-election. If he opposes the Equality Act, 34% of his current supporters say they would be less likely to vote for him next November.
We find that in the race for Congress in 2016, the incumbent Democrat Lipinski starts out ahead of an unnamed Republican challenger. 51% of voters are supporting Lipinski, with 20% supporting a Republican.
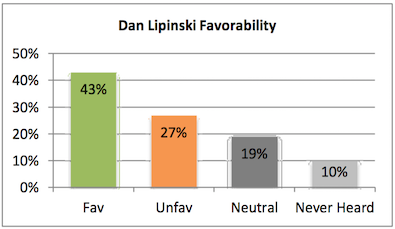
70% of the district’s voters have an opinion on Dan Lipinski, and they’re relatively favorable, with 43% having a favorable view and 27% an unfavorable one. His unfavorable ratings are similar among both Republicans and Democrats – 26% of Democrats have an unfavorable opinion of their Congressman.
Methodology: A poll of registered voters in Illinois’s Third Congressional District. We surveyed 538 voters with an IVR survey and we matched the sample to the voter file and weighted it to reflect the electorate in this district. The margin of error is +/- 5.01% at a 95% confidence interval.
* Charts…
* Questions as asked…
If the November 2016 election were held today and the candidates for Congress were a Republican candidate, or Dan Lipinski, the Democrat, press 1 if you would vote for the Republican, press 2 if you would vote for Lipinski, or press 9 if you’re unsure.
I would like to read you a little bit about some laws being debated in Congress and get your response. The Equality Act is a bill that would extend existing non-discrimination laws to protect gay, lesbian, bisexual, and transgender people in housing, services and public spaces, credit, and employment. Press 1 if you think Congress should pass this law, press 2 if you think Congress should not pass this law, and press 9 if you’re unsure.
If your members of Congress didn’t support this law, would that make you more or less like to vote to re-elect him? Press 1 if you’d be more likely to vote for your member of Congress if they opposed the Equality Act, Press 2 if you’d be more likely to vote against them, and press 9 if it wouldn’t effect your vote.
Discuss.