|
Poll: Just 28 percent say police should have military weapons and vehicles
Friday, Nov 14, 2014 - Posted by Rich Miller * The Paul Simon Public Policy Institute polled Illinoisans on a topical question…
* From the Institute…
You can read the whole poll, with crosstabs, by clicking here. There’s a bunch more interesting stuff in there, including questions like: My local police department represents the racial makeup of my community… 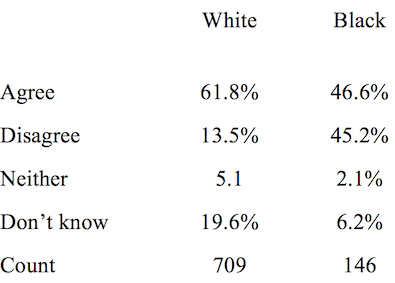 * How would you rate your local police department on police protection?… 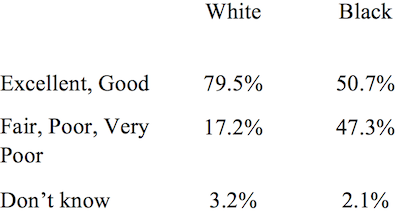 * How would you rate your local police department on the ability to respond quickly to calls for help and assistance?… 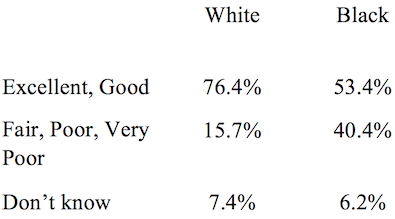 * Should the racial makeup of a community’s police department be similar to the racial makeup of that community as a whole, or isn’t it necessary?… 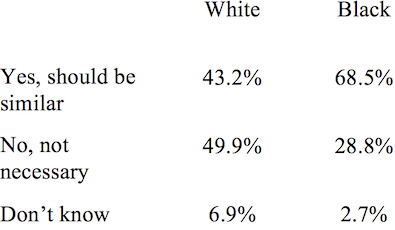 * My local police department responds to the needs of all members of the community… 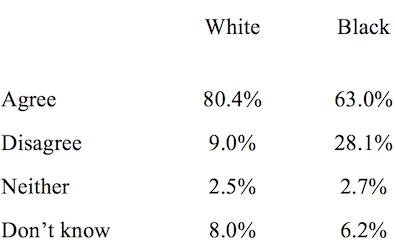
|


| « NEWER POSTS | PREVIOUS POSTS » |